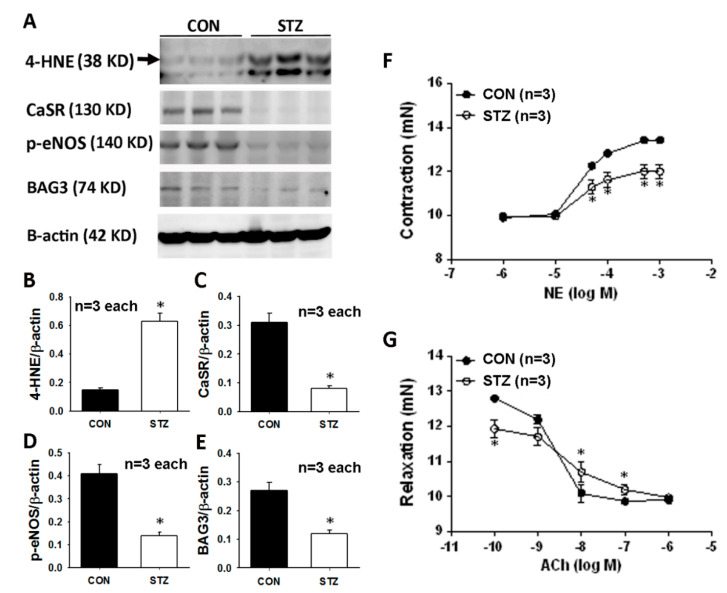
Figure 2.
Mesenteric vascular Western blot graph (A) and analysis of 4-HNE (B), CaSR (C), p-eNOS (D) and BAG3 (E) are demonstrated. Microvascular reactivity from mesenteric arterioles to a vasoconstrictor (norepinephrine, NE, F) and vasodilator (acetylcholine, Ach, G) is displayed in CON and STZ groups. All data are presented as the mean ± SEM (n = 3) using the single values in each test. * p < 0.05 vs. CON group.

