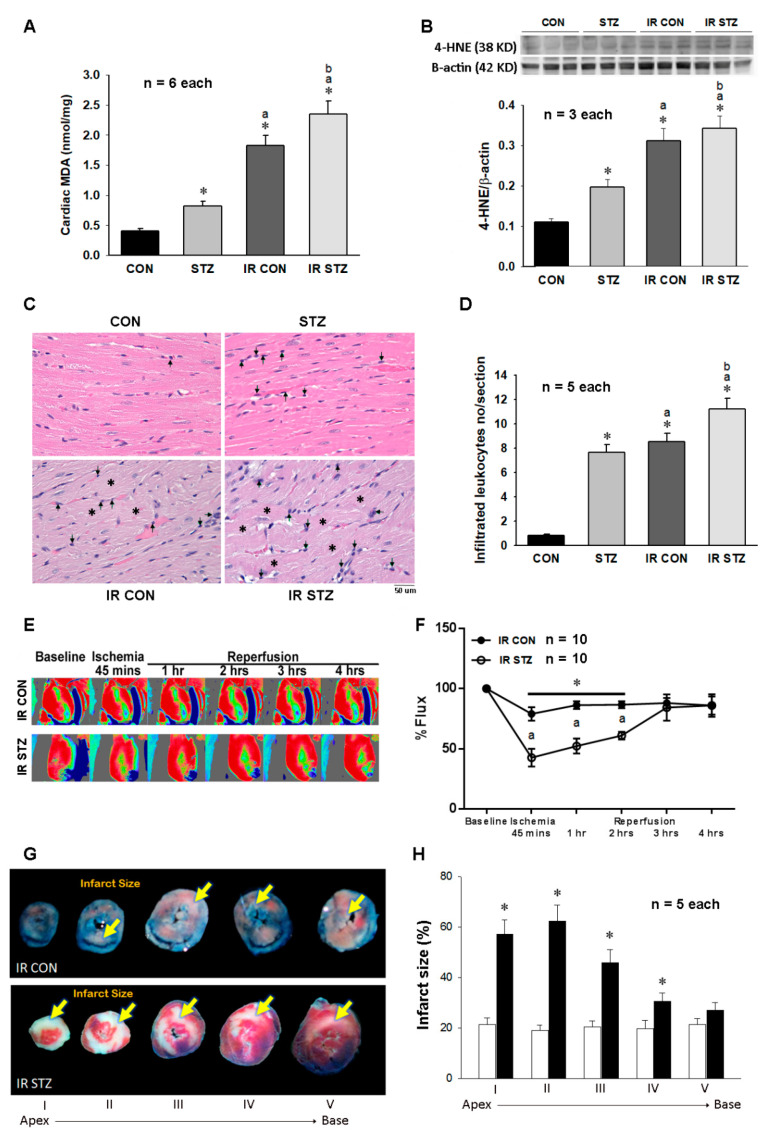
Figure 5.
The diabetes effect on IR affected cardiac lipid peroxidation in MDA content (A, n = 6), 4-HNE expression (B, n = 3), leukocyte infiltration and cardiac structure (C,D, n = 5), microcirculation (E,F, n = 10) and infarct size (G,H, n = 5) in IR CON and IR STZ rats. Data are expressed as mean ± SEM. In graph C, the arrow indicates the infiltrated leukocyte and the star indicates cardiac structural alteration. * p < 0.05 vs. CON, a p < 0.05 vs. STZ.

