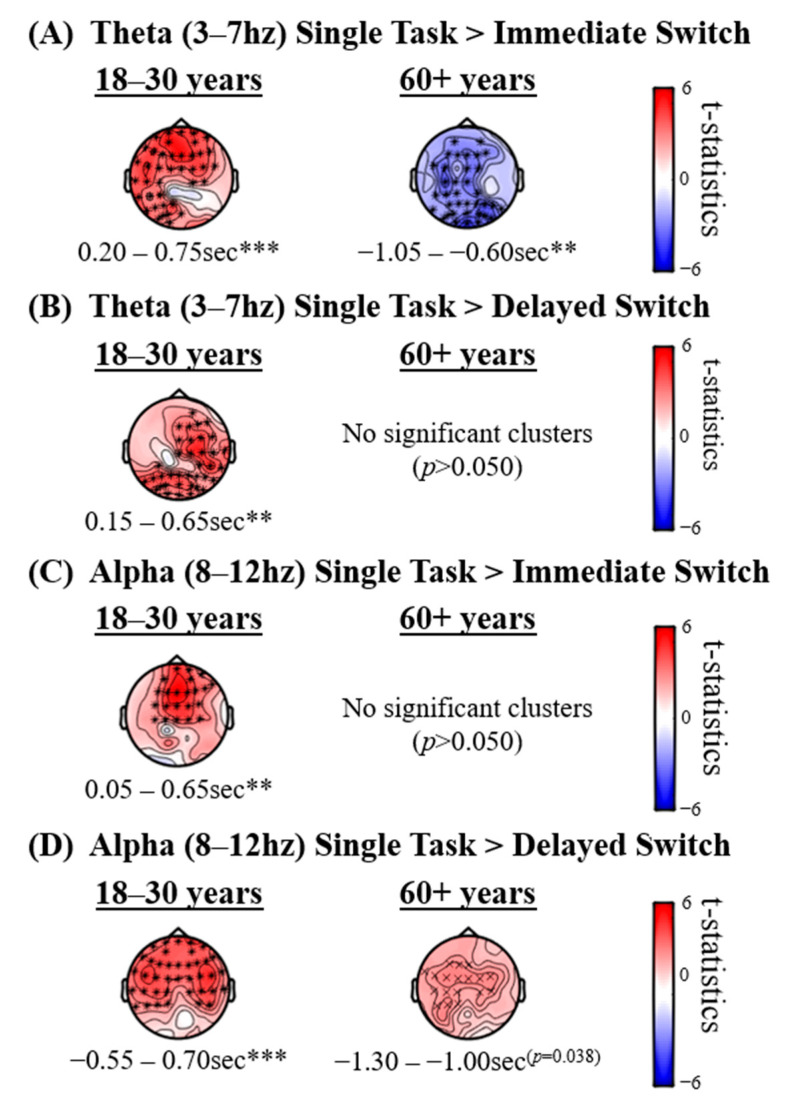
Figure 4.
Effects in theta (3–7 Hz) and alpha (8–12 Hz) EEG power when contrasting Immediate Switch and Single-Task conditions in each age group (A,C), and contrasting Delayed Switch and Single-Task conditions in each age group (B,D). Topographical plots present t-statistics. Cluster significance levels from a two-tailed test are indicated as ** p < 0.01, *** p < 0.001.

