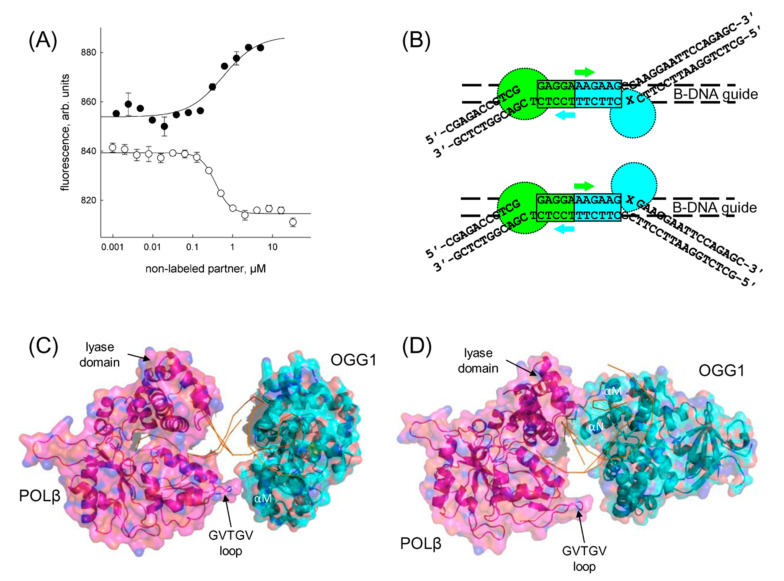
Figure 3.
Interactions of OGG1 and DNA polymerase β. (A) OGG1–POLβ interaction in solution measured by microscale thermophoresis. White circles, POLβ labeled at Cys residues titrated with unlabeled OGG1; black circles, OGG1 labeled at the His-tag titrated with unlabeled POLβ. Mean ± SEM of three independent experiments are presented; (B) scheme of the DNA-guided superposition of OGG1 and POLβ structures (PDB ID 1EBM and 2FMP, respectively). The boxed areas correspond to the DNA parts from the structures superimposed with the simulated B-DNA guide; (C,D) possible structure of OGG1–POLβ encounter complex predicted by DNA-guided docking; OGG1 is on the downstream (C) or the template strand (D). OGG1 is colored cyan, POLβ, magenta, DNA is shown as a backbone trace.

