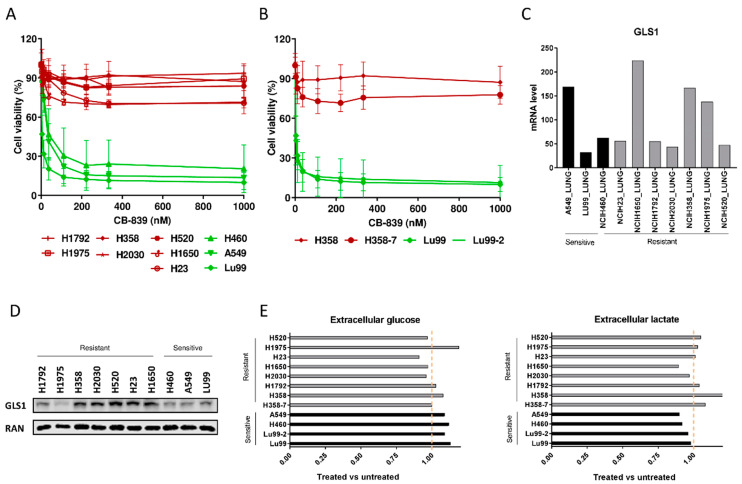
Figure 1.
(A) Dose–response curves of the NSCLC cell lines panel treated with increasing concentrations of CB-839. The response to the drug was assessed 72 h from the start of treatment with the MTS assay. The average of three independent experiments is reported. (B) Dose–response curves of the NSCLC LU99 and H358 LKB1 isogenic systems treated with increasing concentrations of CB-839. The response to the drug was assessed 72 h from the start of treatment with the MTS assay. The average of three independent experiments is reported. (C) GLS1 RNAseq gene expression data retrieved from the CCLE [17], in ten NSCLC cell lines. (D) Western Blot analysis of GLS1 protein levels in the ten NSCLC cell lines used. Ran was used as loading control. The figure is representative of at least three independent experiments. (E) Fold change in abundance (normalized peak area) of extracellular glucose uptake and lactate release in NSCLC CB-839 treated vs. untreated cells (500 nM CB-839, 6 h treatment). Mean ± SD of triplicate culture/conditions.

