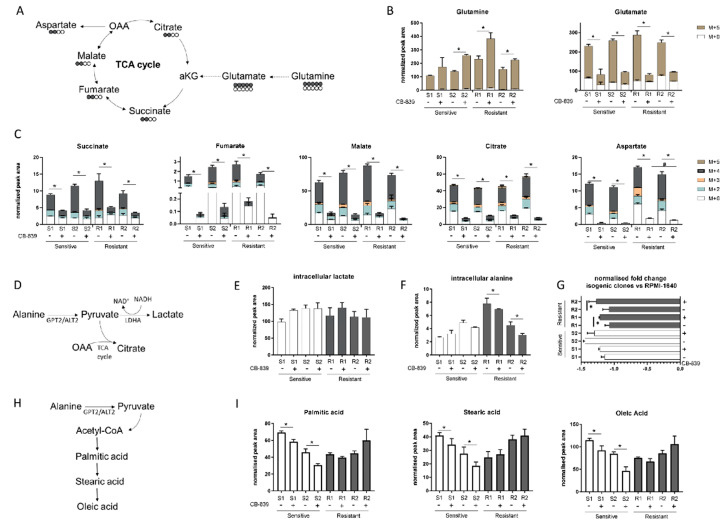
Figure 2.
(A) Schematic representation of the 13-C glutamine labelling experiment. (B) M + 0 and M + 5 glutamine and glutamate abundance in two sensitive and two resistant H1299-derived clones with or without CB-839 (500 nM, 24 h treatment). (C) Isotope labelling of the TCA cycle in the presence of 13C5-glutamine with or without CB-839 (500 nM, 24 h treatment) in two sensitive (S1, KRASwt/LKB1wt, S2, KRASmut/LKB1wt) and two resistant (R1, KRASwt/LKB1del, R2, KRASmut/LKB1del) H1299-derived clones (normalized peak area). (D) Schematic representation of intracellular pyruvate metabolism. (E) Intracellular lactate levels (normalized peak area) with or without CB-839 (500 nM, 24 h treatment) in two sensitive and two resistant H1299-derived clones. (F) Intracellular alanine levels (normalized peak area) with or without CB-839 (500 nM, 24 h treatment) in two sensitive and two resistant H1299-derived clones. (G) Normalized fold change of extracellular alanine levels vs. unconditioned RPMI-1640 with or without CB-839 (500 nM, 24 h treatment) in two sensitive and two resistant H1299-derived clones. (H) Schematic representation of fatty acid biosynthesis. (I) Intracellular levels of fatty acids with or without CB-839 (500 nM, 24 h treatment) in two sensitive and two resistant H1299-derived clones. Mean ± SD of triplicate culture/conditions. Statistical significance * p < 0.05 untreated vs CB-839 treated cells, # p < 0.05 untreated sensitive vs untreated resistant cells, Wilcoxon Mann–Whitney test (M + 0, M + 2, M + 3, M + 4, M + 5).

