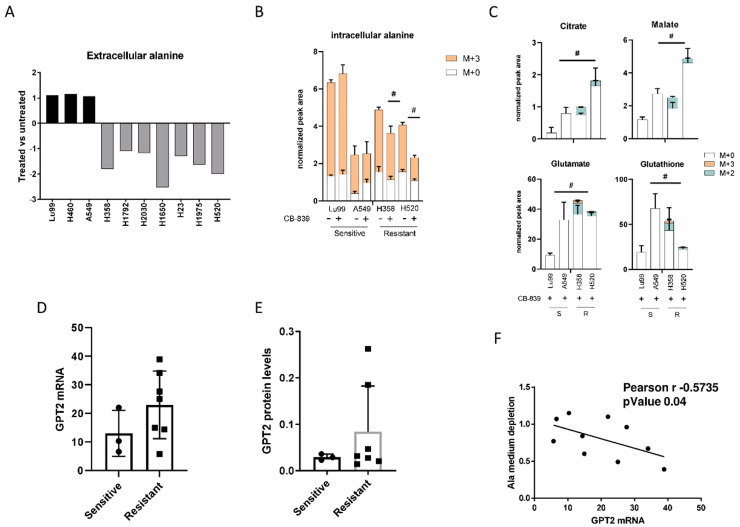
Figure 3.
(A) Changes in extracellular alanine levels in the panel of ten NSCLC cell lines, CB-839-treated vs. untreated, cells (500 nM, 24 h treatment). (B) Unlabeled and 13C3-labelled alanine incorporation (M + 0, M + 3) in two sensitive (LU99, A549) and two resistant (H358, H520) cells, either untreated or CB-839 treated (500 nM, 24 h treatment). (C) The 13C3-alanine-derived carbon labelling (M + 2, M + 3, normalized peak area) of TCA cycle intermediates and citrate, malate, glutamate and glutathione derived metabolites in CB-839 treated sensitive and resistant cells. (D) GPT2 mRNA expression as RNA-seq, retrieved from the CCLE in the sensitive and resistant cells. (E) Western blot analyses of GPT2 expression in the NSCLC cell line panel. Ran was used as loading control. (F) Pearson correlation between alanine uptake from each cell line’s medium and GPT2 mRNA expression, retrieved from the CCLE. The average of three independent experiments is reported. Statistical significance # p < 0.05 refer to significant differences (one-way ANOVA and Tukey Kramer test) of M + 2 and M + 3 in the resistant vs. sensitive cells.

