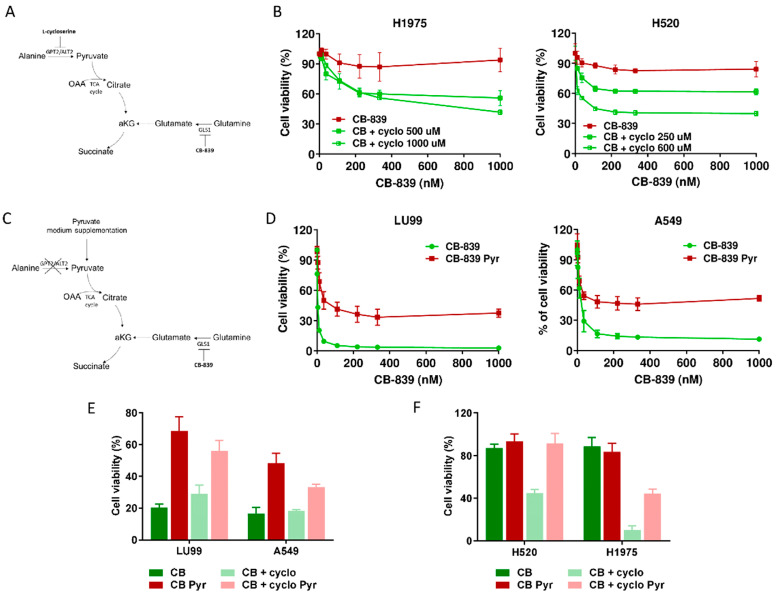
Figure 4.
(A) Schematic representation of metabolic strategy to overcome CB-839 resistance, targeting GPT2 by l-cycloserine (cyclo). (B) Dose–response curves of H1975 (left panel) and H520 (right panel) cells treated with increasing concentrations of CB-839, alone (CB-839) or with l-cycloserine (CB + cyclo) at the reported concentrations. The response to the drugs was assessed with the MTS assay 72 h from the treatment start. (C) Schematic representation of metabolic strategy to induce CB-839 resistance in the sensitive cell lines by pyruvate supplementation, with inhibition of GLS1, alone or together with GPT2. (D) Dose–response curves of LU99 (left panel) and A549 (right panel) cells treated with increasing concentrations of CB-839, grown and treated in standard (CB-839) or pyruvate-enriched medium (CB-839 Pyr). The response to the drug was assessed with the MTS assay 72 h from treatment start. (E) Histograms of LU99 and A549 cells grown in standard or pyruvate-enriched medium (Pyr) and treated with CB-839 (CB, 12 nM for LU99 and 111 nM for A549) and l-cycloserine (cyclo, 75 µM for LU99 and 100 µM for A549), either alone or in combination. The response to the drug was assessed 72 h from the start of treatment with the MTS assay. (F) Histograms of H520 and H1975 cells grown in standard or pyruvate-enriched medium (Pyr) and treated with CB-839 (CB, 1000 nM) and l-cycloserine (cyclo), 250 µM for H520 and 500 µM for H1975), either alone or in combination. The response to the drug was assessed with the MTS assay 72 h from treatment start. The average of three independent experiments is reported. For the sake of clarity, the statistical significance one-way ANOVA and Bonferroni post-test for multiple comparisons (panel B,D,E,F) are reported as Supplemental Table S1, Table S2, Table S3 and Table S4, respectively).

