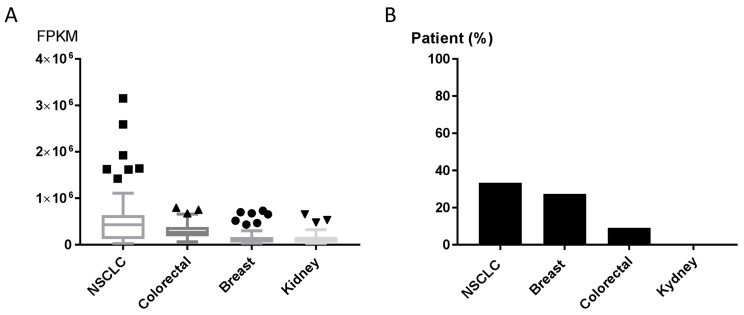
Figure 5.
(A) GPT2 RNA expression as RNA-seq data retrieved from The Cancer Genome Atlas (TCGA) for NSCLC, colorectal, breast and kidney cancer patients. (B) GPT2 protein levels; bars indicate the percentage of patients (12 patients) with high and medium protein expression levels obtained from the Human Protein Atlas [25].

