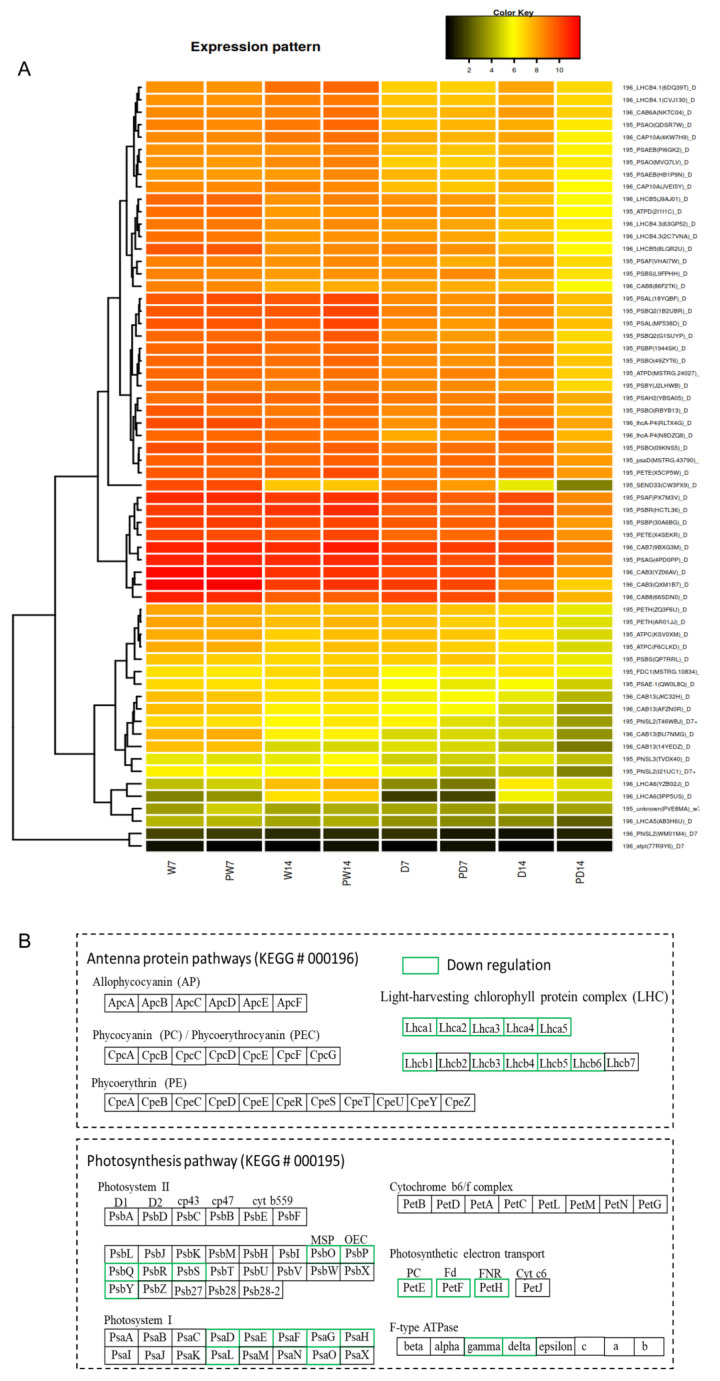
Figure 7.
Comparison of DEGs in photosynthesis-associated pathways under well-watered and drought conditions. (A) The heatmap showing the transcript levels of differentially expressed genes (DEGs) in photosynthesis. Data represent the mean value of expression levels after log2 transformation of fragment per kilobase per million reads (FPKM) from triplicate experiments. Each experiment has six plants. Each line in heatmap for one DEG, DEG name and encoded proteins shown at the right side of heatmap, suffix D representing the DEGs from drought conditions, the prefixes 195 and 196 represent the gene belonging to the photosynthesis pathway (map 00195) and antenna protein pathway (map 00196), respectively, in database KEGG (https://www.genome.jp/kegg/); (B) DEGs encoding proteins in photosynthesis pathways. Green outbox showing the downregulation of DEGs in sample DP14 relative to D14. The abbreviations in boxes are for DEG encoding proteins, whose information is available at KEGG via https://www.genome.jp/dbget-bin/www_bget?map00195 and https://www.genome.jp/dbget-bin/www_bget?map00196.

