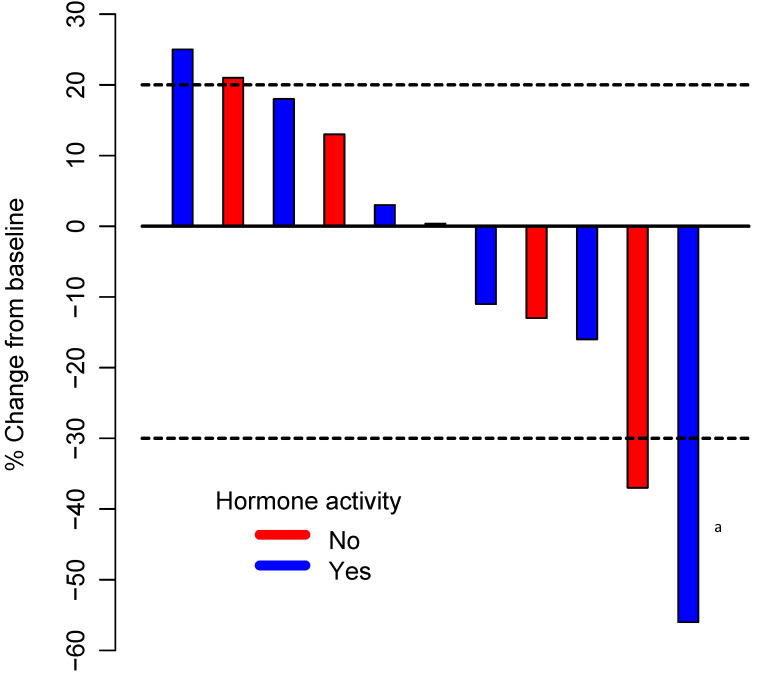
Figure 1.
Waterfall plot illustrating the best response to pembrolizumab therapy in 11 patients. The area below the lower dotted line represents a partial response (30% decrease in the sum of diameters of target lesions compared with the baseline); the area between the two dotted lines represents stable disease; and the area above the upper dotted line represents progressive disease (20% increase in the sum of the diameters of target lesions compared with the smallest sum during the study), based on immune-related Response Evaluation Criteria in Solid Tumors. a Patient with progressive disease (unconfirmed partial response).

