Figure 2.
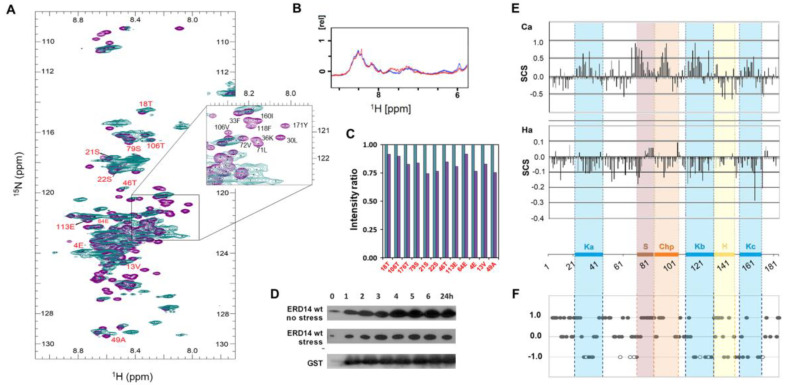
ERD14 is largely disordered in the cytoplasm by in-cell NMR. (A) ERD14 was overexpressed in E. coli cells under 13C- and 15N-labeling conditions and its in-cell 1H-15N HSQC spectrum (teal) was recorded at 700 MHz, T = 277 K. The spectrum is overlaid onto the reference HSQC spectrum (purple) recorded of purified ERD14 at 700 MHz, 277 K at pH 7.7 (cf. Figure S2C (Supplementary Materials)). The majority of the peaks are in good accordance, with certain peaks missing/disappearing due to extensive line broadening (assignment for some peaks is shown, for a complete list, cf. Table S1 (Supplementary Materials)). The narrow region in which peaks are distributed in the proton dimension (8.1–8.8 ppm) indicates that the protein is largely disordered in the cytoplasm of the cell. The region most affected by cellular conditions and interaction partners is also shown as a blow-up. (B) Wild-type (WT) ERD14 is stable in cells during the NMR measurements: overlaid 1D spectra (first day (blue) and 5th day (red)) show no significant change in signal intensity. Cell viability remains after the in-cell NMR measurements: after inoculation of the sample into fresh media, the cells are capable of growing. (C) Comparison of NMR signal intensities within the cell (teal) and after extraction and purification (purple). Twelve peaks (labeled red on 2A) well-defined both in vivo and in vitro were selected for analysis. (D) ERD14 is stable under the conditions of heat stress in the cytoplasm of E. coli cells, as shown by Western blot of FLAG-tagged ERD14 induced by IPTG (at t = 0) following the termination of its expression by the removal of IPTG (at t = 30 min) with and without stress. In comparison, Western blot of GST control is also shown. (E) Previous in vitro NMR studies show that conserved regions of ERD14 sample transient helical structures in isolation: sequence corrected Secondary Chemical Shift (SCS) values. Areas where the Cα values are shifted upfield, while the Hα values are shifted downfield, correspond to partially formed helices (figure partly adapted from [31]). Conserved motifs of EDR14 are marked by colored shading. (F) Based on the assignment and analysis of the in-cell spectrum, we mapped a comparison of in-cell and in vitro NMR spectra on the ERD14 sequence (cf. Suppl. Table S2 (Supplementary Materials)). “Steady” (+1) peaks do not change position, “disappearing” (−1) peaks are not seen in vivo, empty circles represent residues that are disappearing in the presence of high dextran concentration, whereas “broadening” (0) peaks broaden and overlap so much that their identity is difficult to determine in vivo.

