Fig 7.

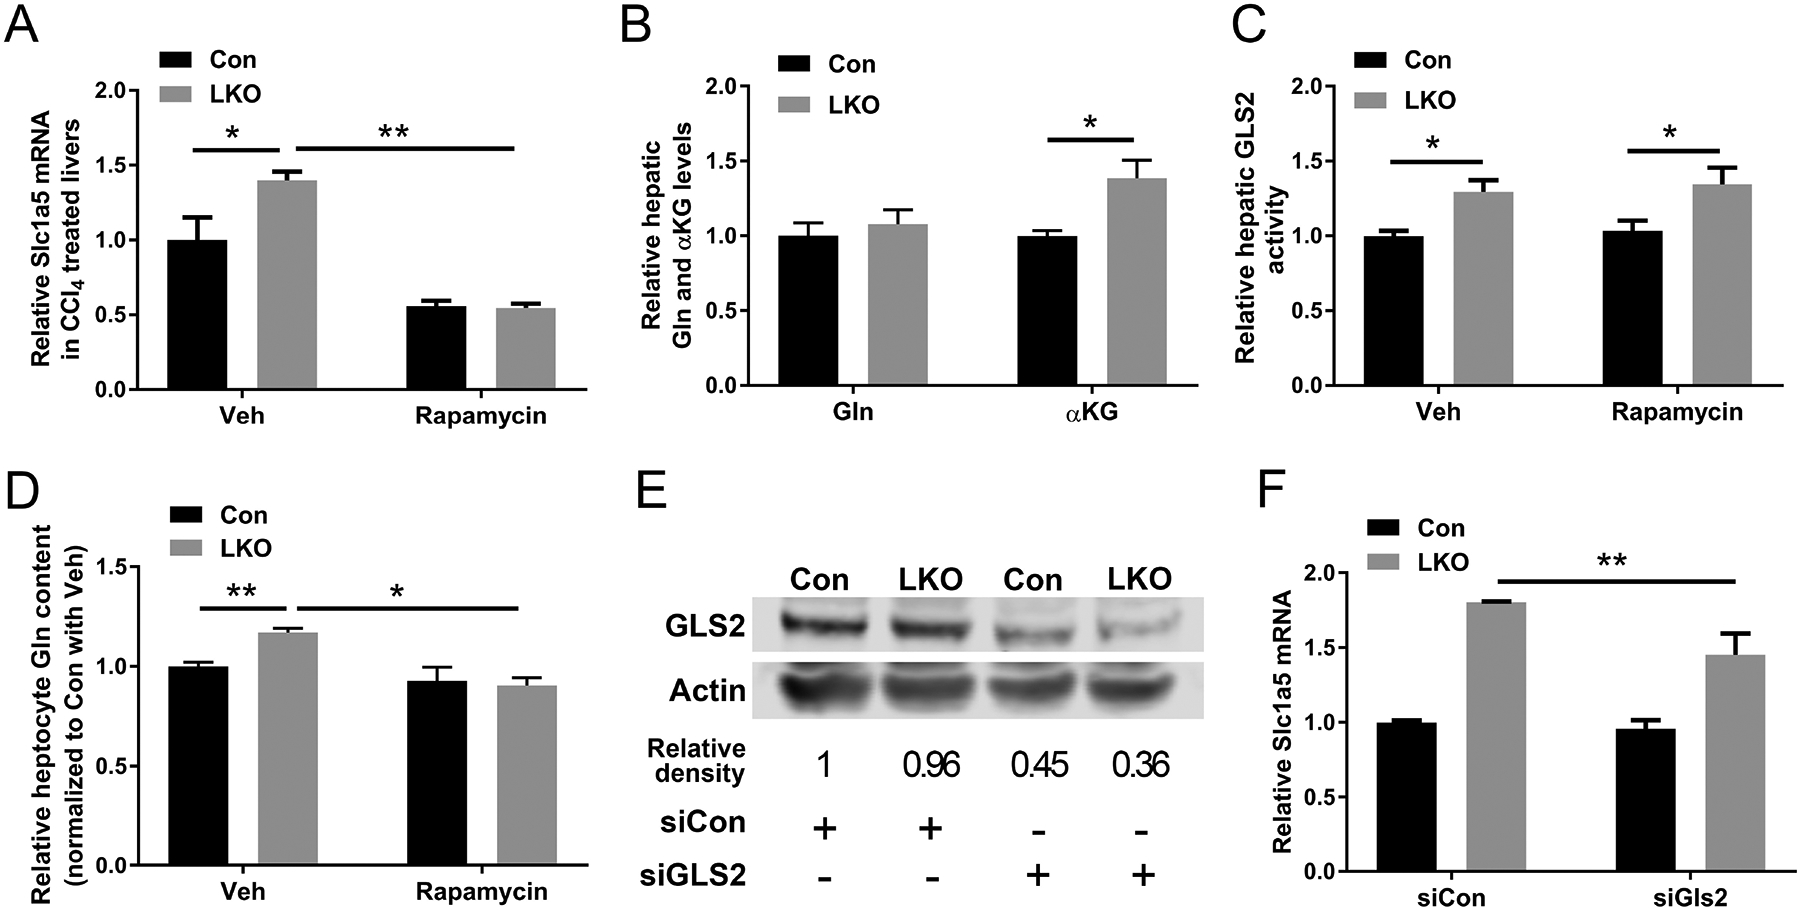
GLS2 but not Slc1a5 is the major control node in enhanced glutaminolysis in GCN5L1 LKO. (A-C) GCN5L1 LKO mice and flox/flox littermates were treated with CCl4 and rapamycin or vehicle (n = 5–7 per group). Quantitative RT-PCR analyses of hepatic mRNA abundance of Slc1a5 (A). Hepatic glutamine and α−KG levels were measured in liver samples following CCl4 and rapamycin administration (B). Mitochondrial fractions were isolated from livers and GLS2 activities were measured using mitochondrial lysates (C). (D) Primary hepatocytes were exposed to rapamycin or vehicle control. Intracellular glutamine levels were measured (n=5–6 per group). (E and F) Primary hepatocytes were transfected with siRNA to knockdown GLS2. The knockdown efficiency was showing by immunoblotting and densitometric analysis (E). Hepatic mRNA abundance of Slc1a5 was analyzed (F) (n = 3 independent experiments). Values are expressed as mean ± s.e.m. *P<0.05, **P < 0.01 versus respective control groups by unpaired Student’s t-test.
