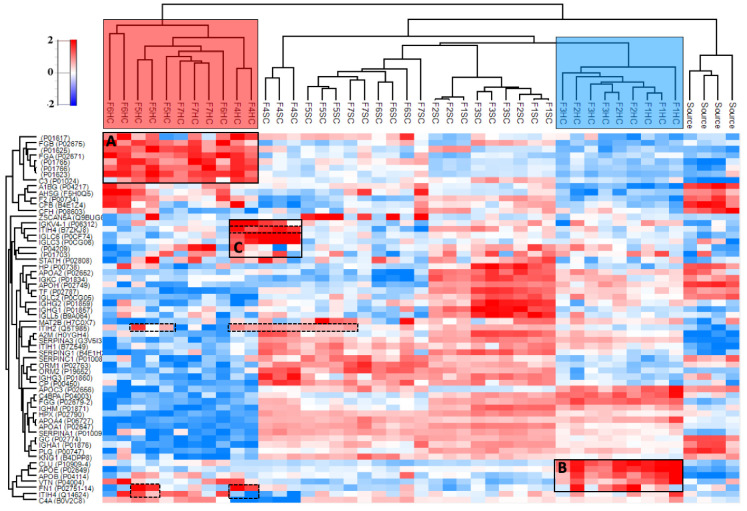
Figure 5.
Heatmap of the top 60 most abundant proteins in at least three samples in human plasma after median normalization (178 proteins). Distinct clusters are observed for the HC, SC, and plasma source (including 1× and 7× diluted, surface plasmon resonance (SPR) instrument flow-through, and untreated). The HC subsections of the tested formulations cluster based on their anionic (light-red box) or neutral (light-blue box) surface charge. The corresponding significantly enriched proteins are highlighted with black boxes (A–C). The dashed boxes indicate the enrichment of hyaluronic acid-binding inter-alpha-trypsin inhibitor heavy chain proteins (ITIH2, ITIH4) and fibronectin (FN1). The range for relative enrichment (red) and depletion (blue) is two standard deviations from the mean on the log2 scale.

