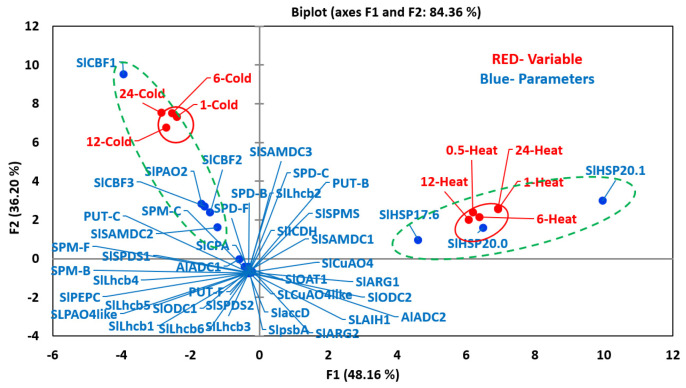
Figure 6.
PCA analyses of variables and parameters during heat and cold stresses. The variables included seedlings treated to increasing time period after applying heat (0.5, 1, 6, 12 and 24 h) and cold (1, 6, 12 and 24 h) stresses. The parameters included levels of free (F), conjugated (C) and bound (B) PUT, SPD and SPM (PUT-F, SPD-F, SPM-F, PUT-C, SPD-C, SPM-C, PUT-B, SPD-B and SPM-B), transcript levels of PAs biosynthesis and catabolizing enzymes genes, heat and cold stress maker genes and photosynthetic-machinery-related genes. For PCA analyses, all values for active and variable parameters were normalized as per cent of that at zero time (before the initiation of respective stresses) values. Other details are the same as stated in the Materials and Methods section. Genes’ abbreviations are given in the Supplemental Table S1. PCA analyses was performed using XLSTAT (https://www.xlstat.com).

