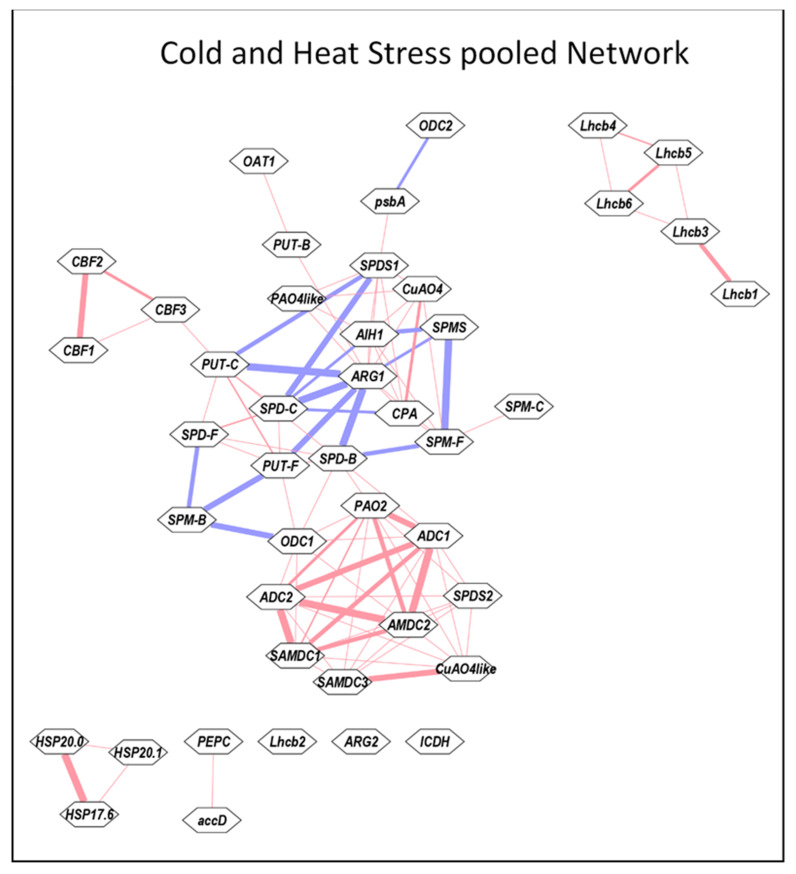
Figure 7.
Cytoscape analyses of Pooled data from heat and cold stresses. All values for the active and the variable parameters were normalized as % initial 0 time point. Before determining correlation coefficient r, data for each parameter was pooled individually from heat and cold stresses. The correlation coefficients were determined using Microsoft EXCEL. These data were analyzed using the Expression Correlation app of the Cytoscape program [65]. Gene abbreviations are the same as in the Table S1.

