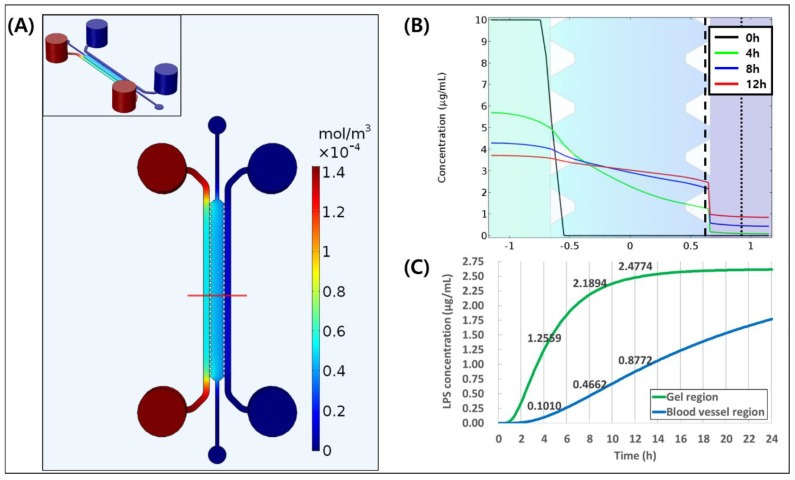
Figure 2.
3D simulation of LPS diffusion in microfluidic chip. (A) The distribution of Lipopolysaccharide (LPS) concentration inside the channel at 12 h. (B) The graph of LPS distribution of red line of (A) at 0, 4, 8, and 12 h. (C) LPS concentration in gel region (dashed line in (B)) and in the blood vessel region (dotted line in (B)).

