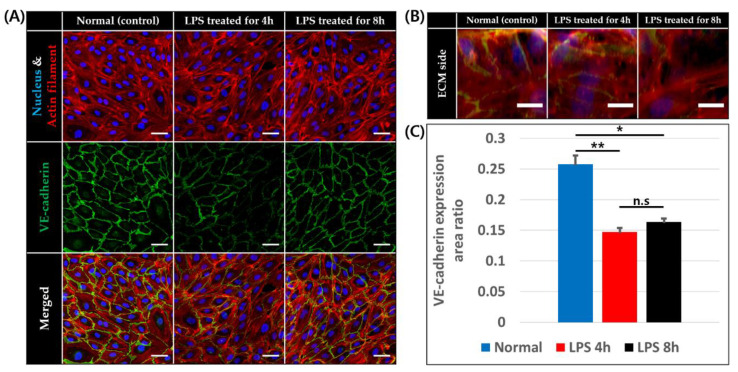
Figure 4.
VE-cadherin expression of endothelial cells at 0, 4, and 8 h after LPS treatment. (A) Confocal image of endothelial cells on basal plane stained for nucleus (blue), actin filament (red), and VE-cadherin (green), scale bar = 50 μm. (B) Z-stack image of endothelial cells on ECM side stained for nucleus (blue), actin filament (red), and VE-cadherin (green), scale bar = 20 μm. (C) VE-cadherin expression area to endothelial cell area ratio on basal plane (n = 4 × 3 for normal and LPS treated for 4 h, n = 3 × 3 for LPS treated for 8 h, n.s: not significant *: p < 0.0001, **: p < 0.00001).

