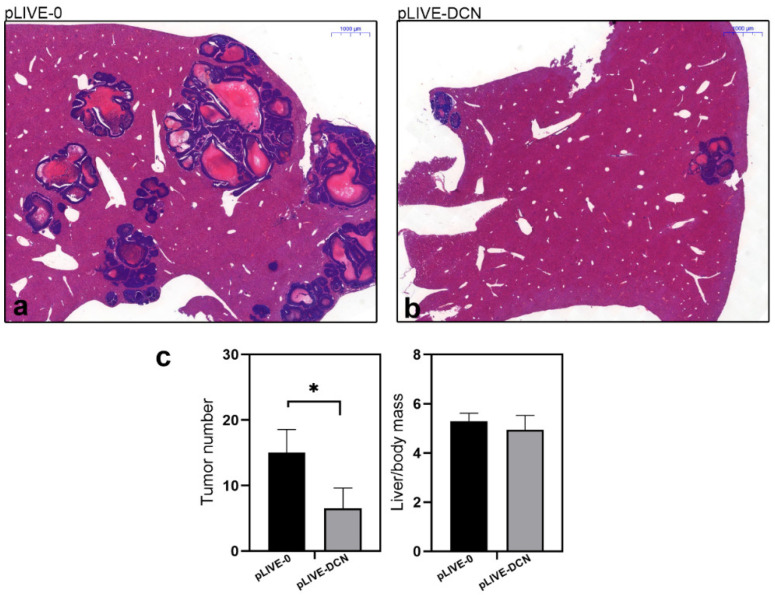
Figure 4.
Representative histological images of hematoxylin and eosin-stained control (pLIVE-0) (a), and decorin expressing (pLIVE-DCN) (b) liver tissues after inoculation of c38 tumor cells. Bar charts (c) represent the ratios of tumor-bearing mice in experimental groups of control and DCN expressing groups. In livers overexpressing decorin, a reduced number of liver metastases was observed in parallel with lower liver mass/body ratio. Scale bar = 1000 µm. * p value < 0.05.

