Figure 3.
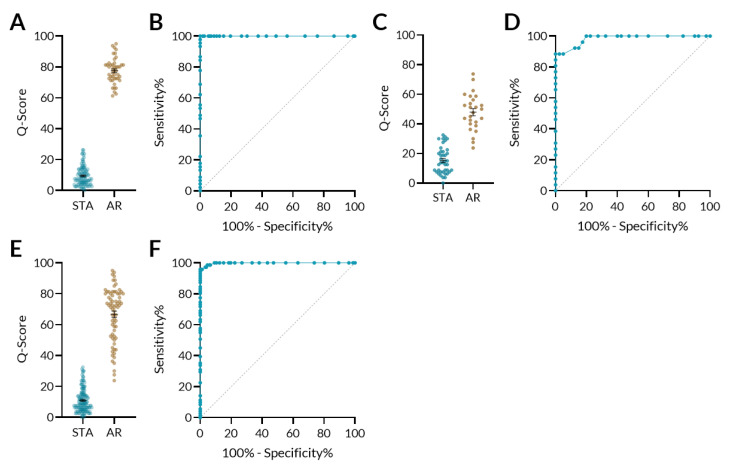
QSant performance: The selected urinary biomarkers could segregate non-rejection patients from those with acute rejection. (A) The model was trained on 157 samples consisting of 112 stable transplant allograft (STA) and 45 acute rejection (AR) samples in the training set to generate a scaled score ranging from 0 to 100. At a threshold of 32, the sensitivity was 100% and the specificity was 100%. (B) The area under the curve (AUC) of the receiver–operator characteristic (ROC) curve of the training cohort was 100%. (C) In the independent validation set, the Q-Score model was applied to a set of 66 independent samples consisting of 40 STA and 26 AR samples. At the pre-determined threshold of 32, the sensitivity was 95.8% (95% CI: 78.9–99.8%) and the specificity was 92.9% (95% CI: 80.5%-98.5%). (D) The AUC of the ROC curve of the validation cohort was 98.3% (95% CI: 0.96–1.0). (E) At the threshold of 32 for the entire dataset, sensitivity was 95.8% (95% CI: 88.14–99.12%) and specificity was 99.3% (95% CI: 96.4–99.9%). The PPV was 98.0% (95% CI: 87.3–99.7%) and the NPV was 98.6% (95% CI: 95.9–99.5%). (F) AUC for the entire data was 99.8%.

