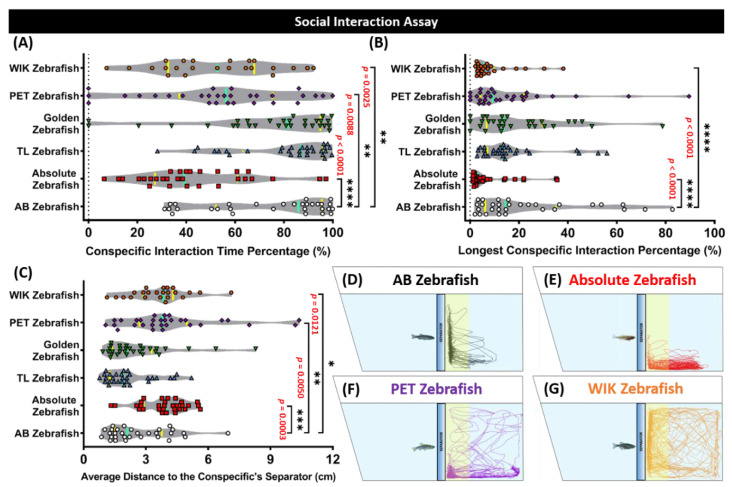
Figure 4.
Social interaction behavior endpoint comparisons between the AB zebrafish (white), absolute zebrafish (red), TL (Tübingen Long Fin) zebrafish (blue), golden zebrafish (green), PET (Pet Store-purchased) zebrafish (purple), and the WIK (Wild Indian Karyotype) zebrafish (orange). (A) Conspecific interaction time percentage, (B) longest conspecific interaction percentage, and (C) the average distance to the conspecific’s separator were analyzed for the social interaction assay. The median and the interquartile for the violin plot were labeled with the bold line colored with cyan and yellow, respectively. The 5 min locomotor trajectories for the AB, absolute, PET, and WIK zebrafish are presented in (D–G), respectively, with the yellow colored zone as the interacting conspecific region. The data were analyzed by a Mann–Whitney test (n = 30 for each group, except for the WIK zebrafish (n = 23); * p < 0.05; ** p < 0.01; *** p < 0.001; **** p < 0.0001).

