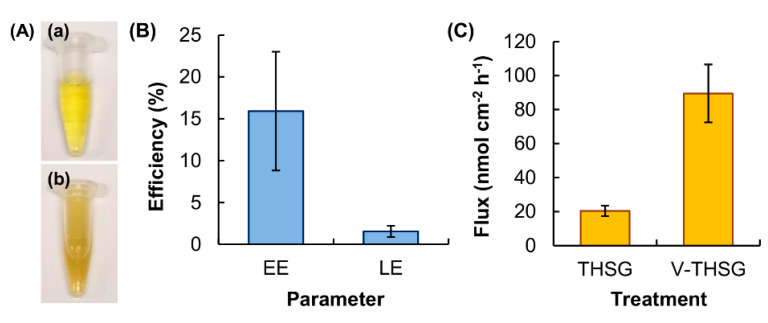
Figure 3.
(A) Images of solutions of (a) THSG and (b) V-THSG. (B) The EE and LE of the vesicles. Data are presented as the means ± SD of triplicate experiments. (C) The transdermal flux of THSG from the plain THSG solution and the V-THSG solution. Data are presented as the means ± SD of triplicate experiments.

