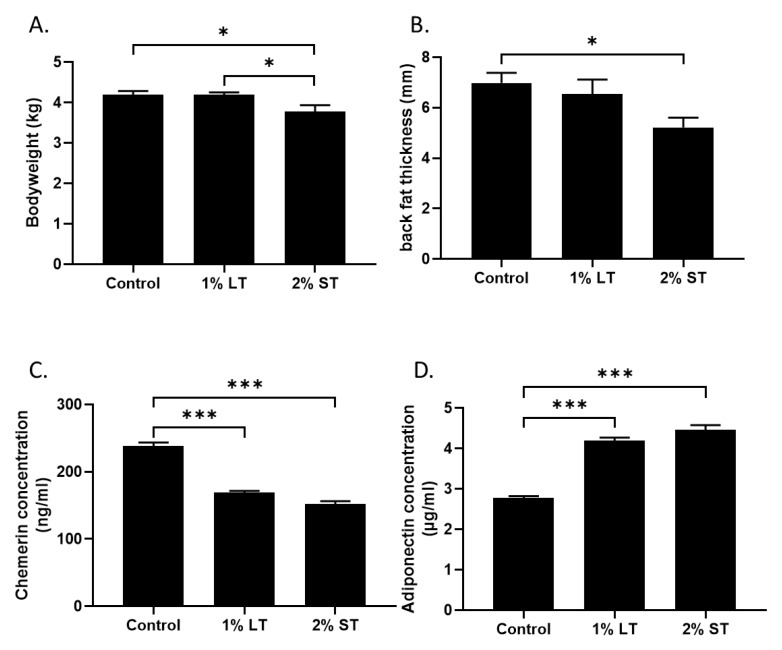
Figure 1.
(A) Bodyweight of 3 groups (Control; 1% LT; 2% ST) at 40th week of age. (B) The thickness of back fat (mm), as a marker of fat mass, was measured by ultrasonography. (C,D) Plasma concentrations of chemerin and adiponectin were measured at 40th week to evaluate the metabolic status of the animals. (n = 10 animals/group). Control, 1% Long Treatment, 1% LT; 2% Short Treatment, 2% ST. *, p < 0.05; ***, p < 0.001, significant differences with the control.

