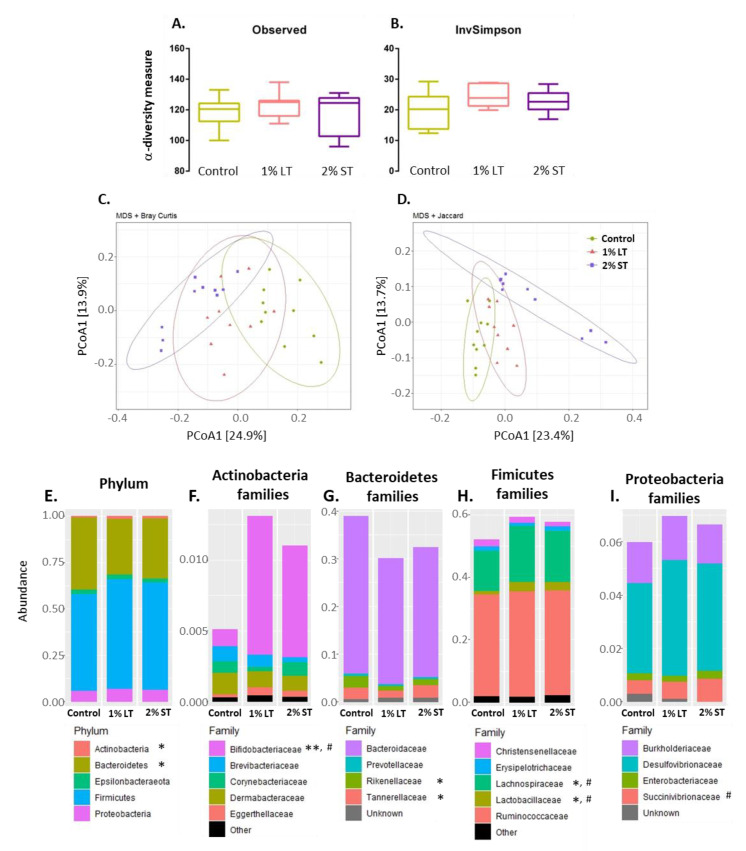
Figure 2.
Microbiota composition of the caecum content collected at 40th week of age from hens of 3 groups (Control; 1% LT; 2% ST). Evolution of -diversity represented by observed species richness (A) and Inverse Simpson Index (B). Principal coordinates analysis (PCoA) multi-dimensional scaling (MDS) of Bray–Curtis (C) and Jaccard (D) compositional dissimilarity between samples. Average relative abundance at phylum (E) and family (F–I) level in the caecal content of each group. Observed species richness and Inverse Simpson Index values are means ± SEM compared by one-way ANOVA followed by Tukey’s post hoc test. Phylum and family relative abundance data were compared using the Kruskal–Wallis test; * indicates significantly different abundances between Control and 1% LT (with * p < 0.05, ** p < 0.01), # between Control and 2% ST (with # p < 0.05). Control, 1% Long Treatment, 1% LT; 2% Short Treatment, 2% ST.

