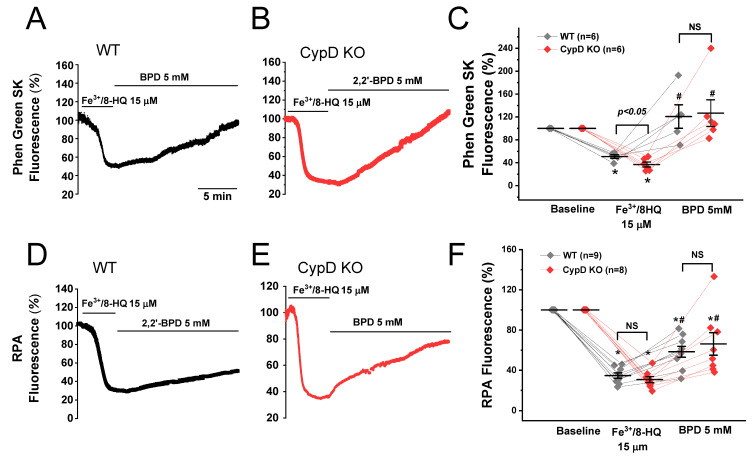
Figure 1.
Cytosolic and mitochondrial Fe loading in ventricular myocytes isolated from WT and CypD KO mice. The level of cytosolic Fe was measured using Phen Green SK fluorescence in WT (A) and CypD KO myocytes (B). The baseline fluorescence levels (arbitrary units, AU) were normalized to 100%. Cytosolic Fe loading was achieved by continuous superfusion with 15 μM Fe3+/8-HQ. Decreased fluorescence intensity of Phen Green SK indicated the increase in cytosolic Fe levels. Note that the quenched fluorescence was reversed in the presence of the membrane-permeable Fe chelator 2,2′-bipyridyl (BPD). Summarized data (C) were obtained from 6 WT cells and 6 CypD KO cells, respectively. Similarly, mitochondrial Fe loading was measured by using rhodamine B-[(1,10-phenanthroline-5-yl)-aminocarbonyl]benzyl ester (RPA) fluorescence in WT (D) and CypD KO myocytes (E). Data are summarized in (F). Data were obtained from 9 WT cells and 8 CypD KO ventricular myocytes. * p < 0.05 compared to the baseline in WT and CypD, respectively; # p < 0.05 compared to the Fe3+/8-HQ treatment group in WT and CypD, respectively, by using paired t-test. Except for Fe3+/8-HQ-induced Phen Green SK fluorescence, no significant difference was observed between WT and CypD KO.

