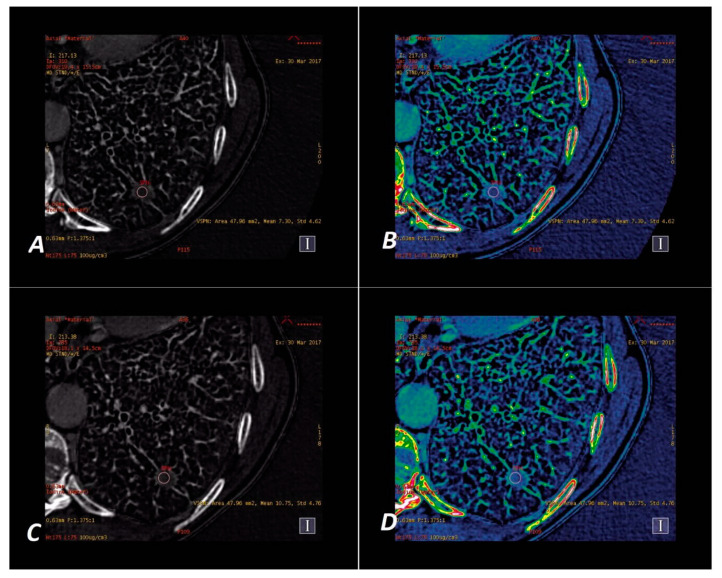
Figure 5.
A 60-year-old man with tuberculoma. Iodine–based SSDECT images in AP (A,B) and VP (C,D). Iodine material density ssDECT image shows the iodine content in the region that shows hyperattenuation in SPN on Figure 3a,c. Colormap “French” (B,D) helps to identify the tumor compared to their standard presentation in “Linear Gray” (A,C). Iodine concentration mean = 7.30 × 100 µg/cm3 (AP) and 10.75 × 100 µg/cm3 (VP).

