Figure 3.
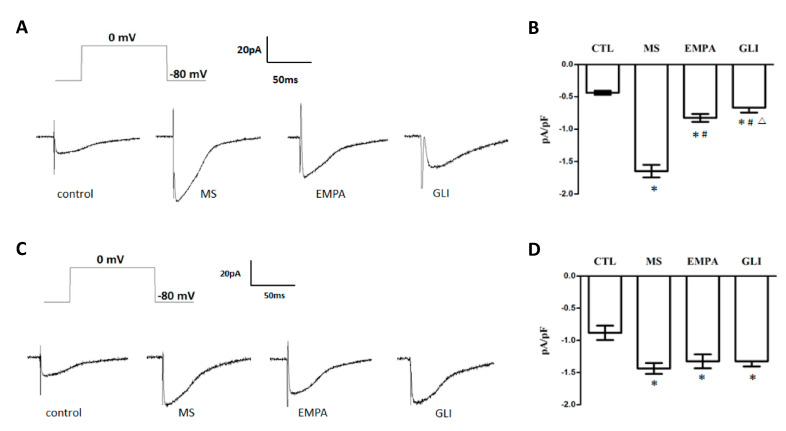
Effects of adipocytokines from the pericardial and peripheral fat tissues of study groups on L-type calcium channel current (ICa,L) in H9c2 cells. (A) Representative recordings of the ICa,L evoked by applying a pulse of 0 mV for 300 ms at a holding potential of −80 mV in H9c2 cells treated with adipocytokines from the pericardial fat of different groups for 18 h. (B) Bar graph showing the ICa,L (pA/pF) averaged from the recordings of the trace (n = 6). (C) Representative recordings of the ICa,L evoked by applying a pulse of 0 mV for 300 ms at a holding potential of −80 mV in H9c2 cells treated with adipocytokines from the peripheral fat of different groups for 18 h. (D) Bar graph showing the ICa,L (pA/pF) averaged from the recordings of the trace (n = 6) (C). Data are the means ± standard deviation. * p < 0.05 compared with the control. # p < 0.05 compared with the MS; △p < 0.05 compared with the EMPA; MS: metabolic syndrome; EMPA: empagliflozin; GLI: glibenclamide.

