Figure 1.

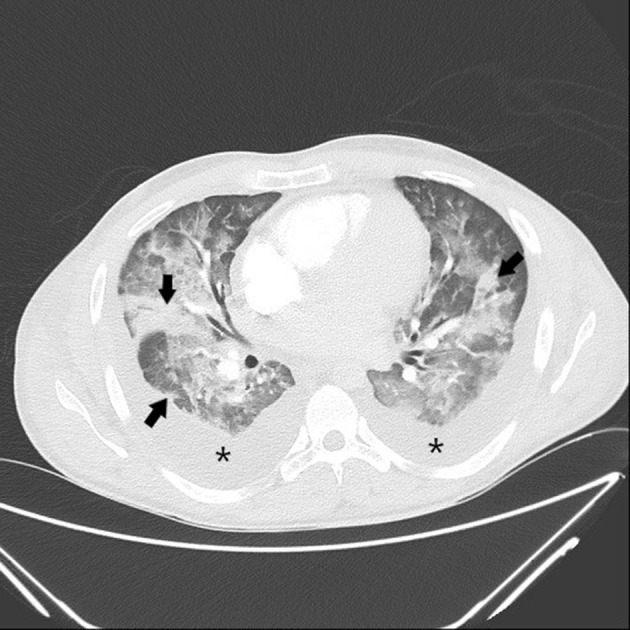
Axial contrast-enhanced CT scan of the chest shows bilateral pleural effusion (*) and multifocal patchy consolidations (black arrows).

Axial contrast-enhanced CT scan of the chest shows bilateral pleural effusion (*) and multifocal patchy consolidations (black arrows).