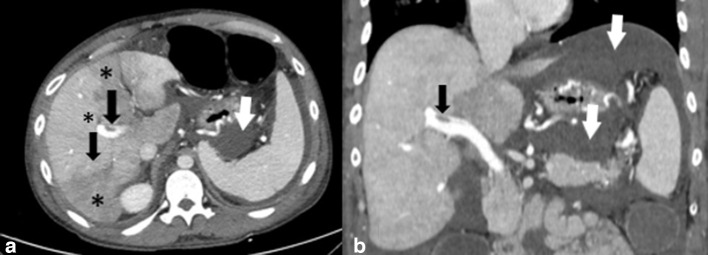
Figure 2.
Axial (a) and coronal (c) contrast-enhanced CT images of the abdomen demonstrate a clot within the portal vein (black arrows). There are altered patchy areas of hepatic parenchymal enhancement (*) that are suggestive of occlusion of small branches of the portal vein. Intraperitoneal fluid is also seen on CT images (white arrows).

