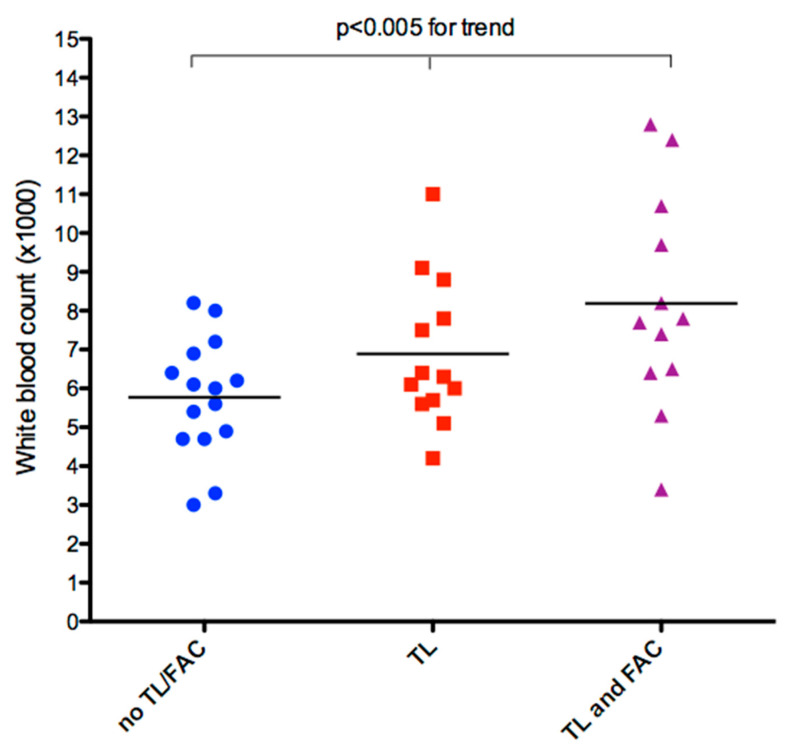
Figure 4.
Individual value bar graph of WBC count versus lead fibrosis. There is a significant, progressive mean increase in WBC, with a large effect size all the way up to the major classes of lead fibrosis, as assessed by ultrasound. (F = 9.007, p < 0.005 for trend, partial eta squared = 0.196); TL—thickened lead; FAC—fibrosis fixing the lead to the cardiac wall; WBC—white blood cell count.

