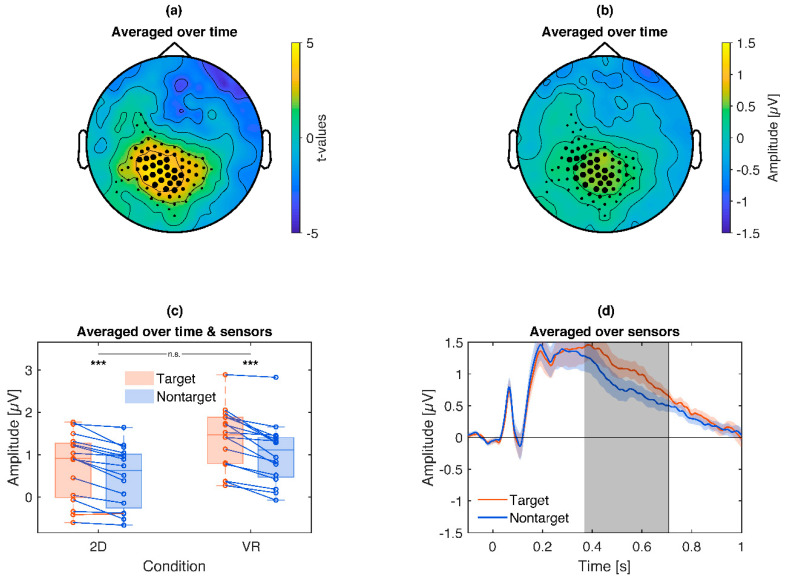
Figure 9.
Illustration of the target P3 cluster: Target pictures lead to an enhanced P3 compared to nontarget pictures. (a): Topography of t-values averaged across the significant time points. (b): Topography of the scalp potential difference. (c): Box plot and single subject values from the cluster. Blue lines indicate a more positive P3 for target compared to nontarget pictures, red the opposite. Asterisks illustrate the significance of exploratory post-hoc subgroup comparisons: *** p < 0.001, ns p > 0.05. (d): Time course of the respective P3 cluster. Colored shaded areas signify standard errors. Grey shaded areas signify the latency of the cluster.

