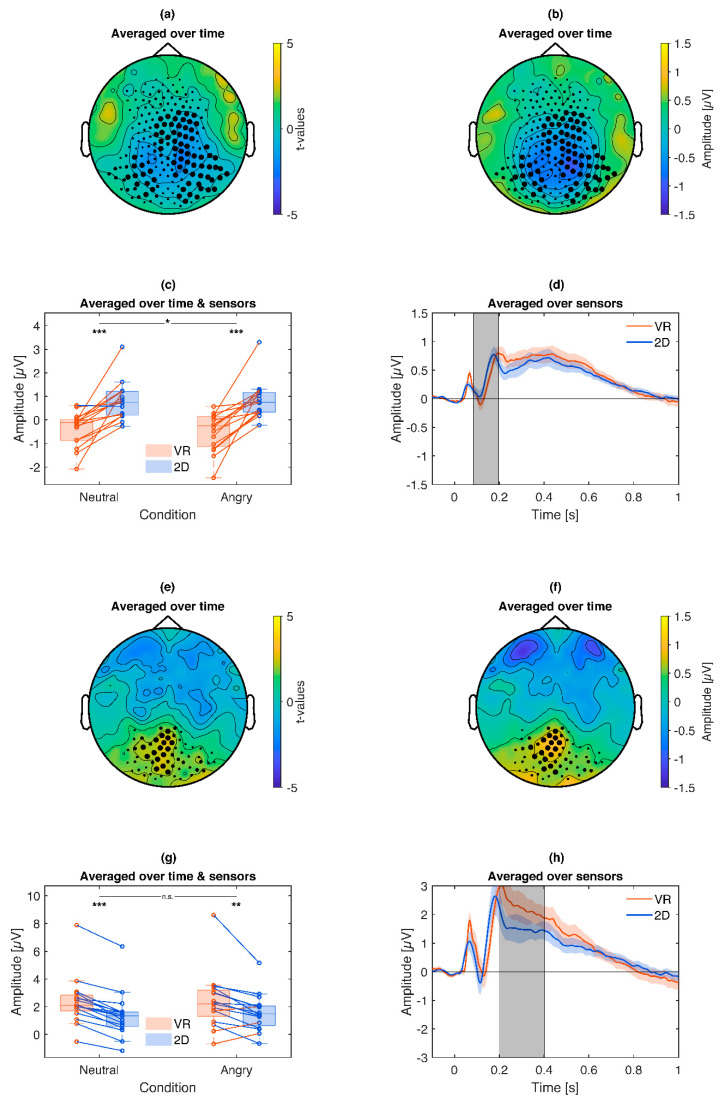
Figure 10.
Illustration of the VR vs. 2D ERP effect: (a–d) VR stimulation leads to overall stronger ERPs and specifically more so for angry faces in an earlier time frame. (e–h) VR stimulation also leads to overall stronger ERPs in the time frame of the LPP and P3. (a) & (e): Topography of t-values averaged across the significant time points. (b) & (f): Topography of the scalp potential difference. (c) & (g): Box plot and single subject values from the respective cluster. Blue lines indicate a more positive ERP for VR compared to 2D conditions, red the opposite. Asterisks illustrate the significance of exploratory post-hoc subgroup comparisons: *** p < 0.001, ** p < 0.01, *p < 0.05, ns p > 0.05. (d) & (h): Time course of the respective cluster. Colored shaded areas signify standard errors. Grey shaded areas signify the latency of the cluster.

