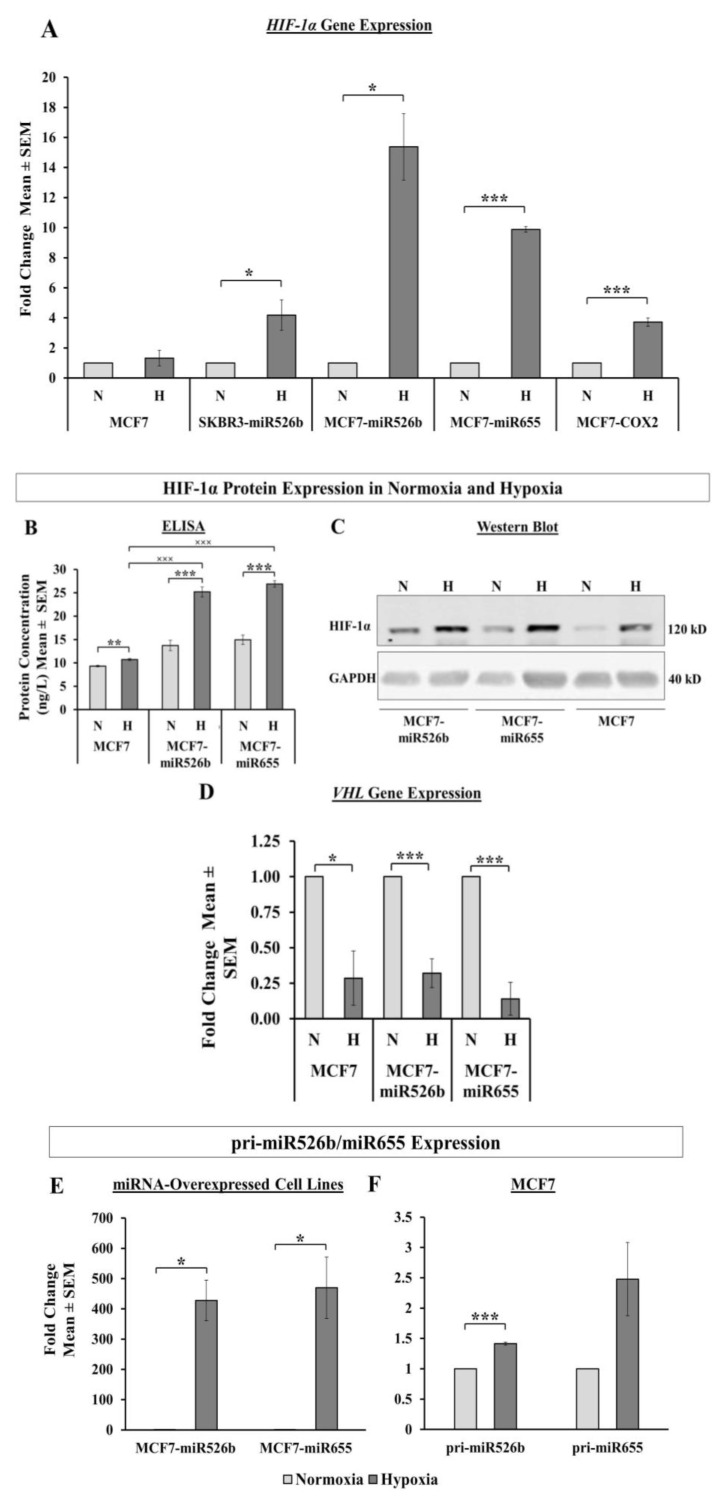
Figure 2.
Induction of hypoxia using CoCl2: In all figures, ‘N’ indicates normoxia and ‘H’ indicates hypoxia. (A) Gene expression of HIF-1α in MCF7, SKBR3-miR526b, MCF7-miR526b, MCF7-miR655, and MCF7-COX2 cell lines under normoxic and hypoxic conditions measured using qRT-PCR. (B) Protein levels of HIF-1α in MCF7, MCF7-miR526b, and MCF7-miR655 cell lines measured using ELISA. (C) Total HIF-1α protein expression in both hypoxia and normoxia were measured with western blots. Complete western blots are presented in Figure S3D. (D) VHL gene expression in MCF7, MCF7-miR526b, and MCF7-miR655 cell lines measured via qRT-PCR. (E) Pri-miRNA expression in MCF7-miR526b and MCF7-miR655 cells in normoxia and hypoxia. (F) Pri-miRNA expression in MCF7 cells in normoxia and hypoxia. Data are presented as the mean ± SEM of triplicate biological replicates; * p < 0.05, ** p < 0.01, *** p < 0.001, and xxx indicates p < 0.001. * Also indicates comparison between normoxia and hypoxia of the same cell line and x indicates comparison between cell lines only in a hypoxic condition.

