Figure 3.
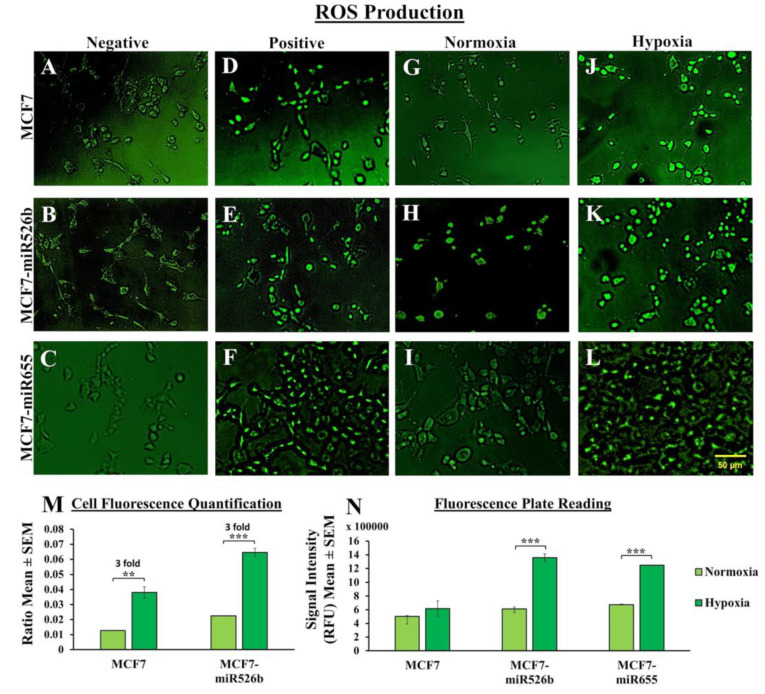
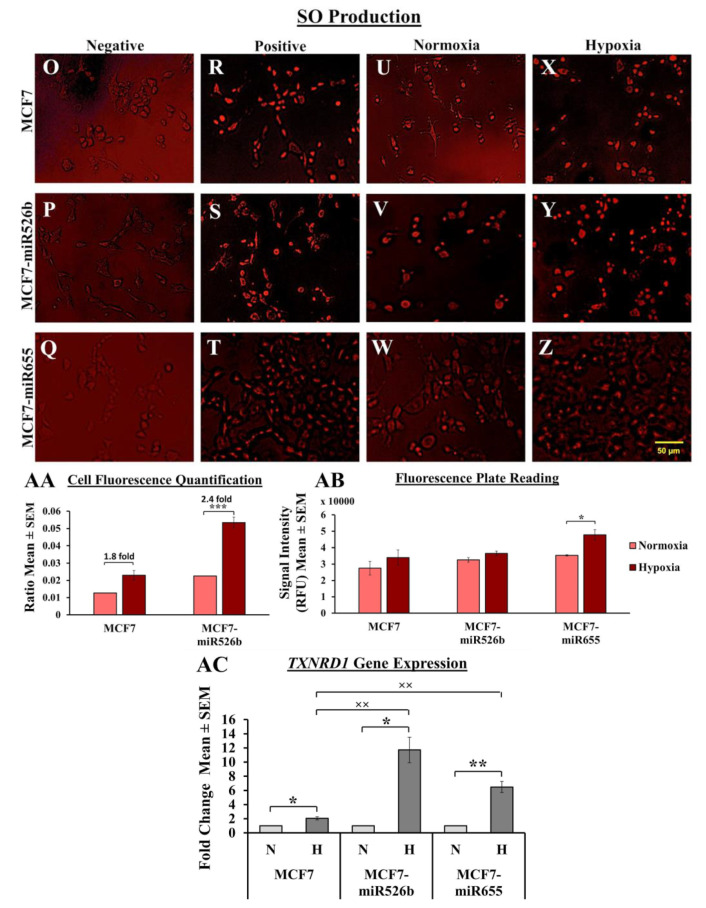
Fluorescence microscopy and fluorescence microplate assays to quantify ROS and SO production: MCF7, MCF7-miR526b, and MCF7-miR655 cells in (A–C) negative control, (D–F) positive control, (G–I) in normoxia, and (J–L) in hypoxia under the green filter for total ROS detection. (M) Quantification ratios of MCF7 and MCF7-miR526b cells positive for ROS in normoxia and hypoxia. (N) Fluorescence microplate assay to quantify total ROS production in MCF7, MCF7-miR526b, and MCF7-miR655 cells. Fluorescent SO-positive MCF7, MCF7-miR526b, and MCF7-miR655 cells (O–Q) in negative control, (R–T) in positive control, (U–W) in normoxia, and (X–Z) in hypoxia under the red filter for total SO detection. (AA) Quantification ratios of MCF7 and MCF7-miR526b cells positive for SO in normoxic and hypoxic conditions. (AB) Fluorescence microplate assay to quantify total SO production in MCF7, MCF7-miR526b, and MCF7-miR655 cells. (AC) Gene expression of TXNRD1 measured with qRT-PCR. ‘N’ indicates normoxia, and ‘H’ indicates hypoxia. Scale bar represents 50 μM. (M,N,AA,AB,AC) Data are presented as the mean ± SEM of triplicate biological replicates; * p < 0.05, ** p < 0.01, *** p < 0.001, and xx indicates p < 0.01. * Also indicates comparison between normoxia and hypoxia of the same cell line and x, indicates comparison between cell lines only in a hypoxic condition.


