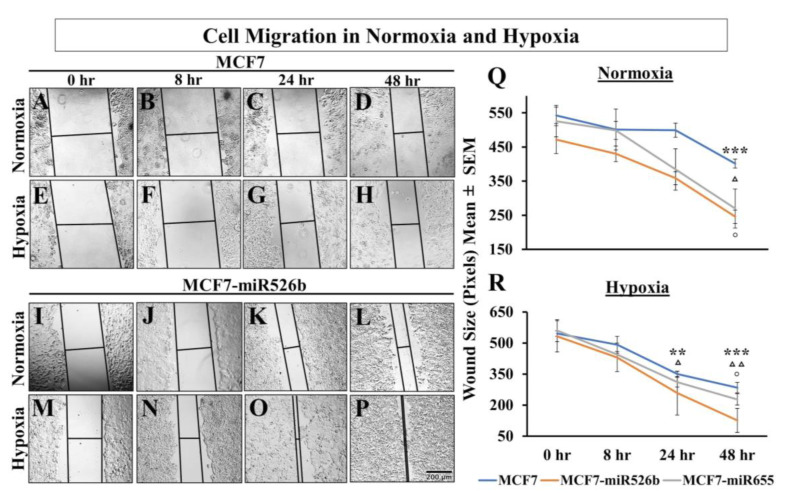
Figure 5.
Cell migration in normoxia and hypoxia: baseline scratches represented by black lines at 0, 8, 24, and 48 h time points. Representative images of MCF7 are presented in (A–D) normoxia and (E–H) hypoxia. Representative images for MCF7-miR526b are presented in (I–L) normoxia and (M–P) hypoxia. Scale bar represents 200 µM. Wound size measured in pixels. (Q) Mean wound size in normoxic conditions over 0–48 h. (R) Mean wound size in hypoxic conditions over 0–48 h. Data are presented as the mean ± SEM of quadruplicate biological replicates; ** p < 0.01 and *** p < 0.001. * = MCF7, ◦ = MCF7-miR526b, ∆ = MCF7-miR655.

