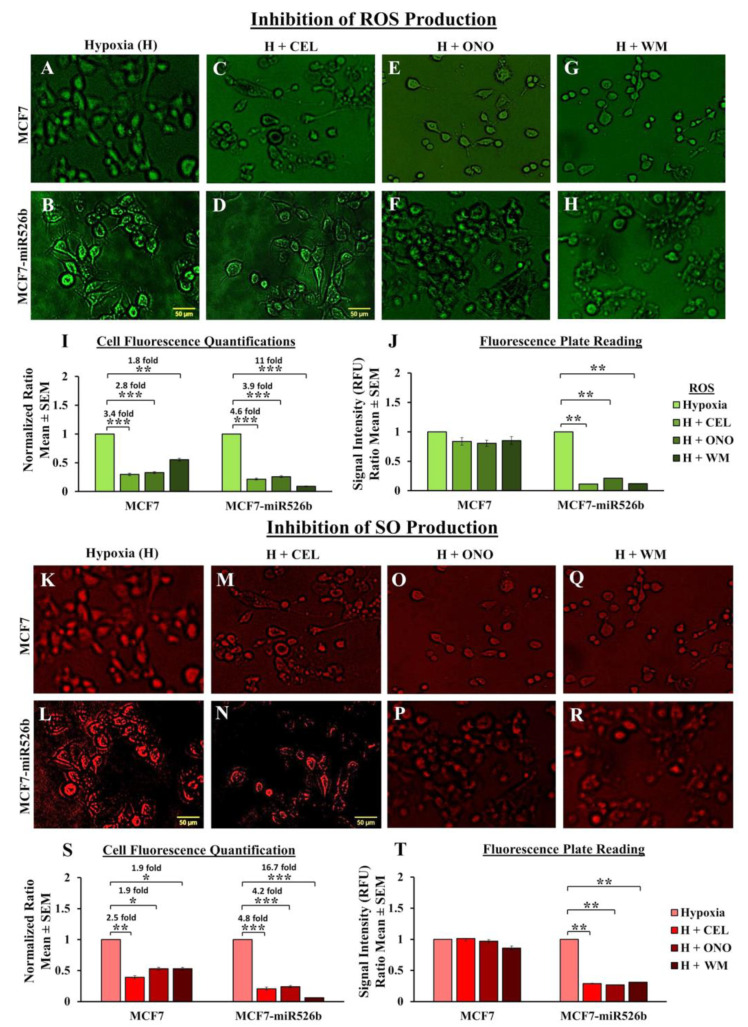
Figure 8.
Inhibition of ROS and SO production: Representative MCF7 and MCF7-miR526b cells in (A,B) hypoxia, (C,D) hypoxia with CEL, (E,F) hypoxia with ONO, and (G,H) hypoxia with WM under the green filter for total ROS detection. (I) Quantification ratios for MCF7 and MCF7-miR526b cells positive for ROS. (J) Fluorescence microplate assay to quantify total ROS production. Fluorescent MCF7 and MCF7-miR526b cells in (K,L) hypoxia, (M, N) hypoxia with CEL, (O,P) hypoxia with ONO, and (Q,R) hypoxia with WM under the red filter for total SO detection. (S) Quantification ratios of MCF7 and MCF7-miR526b cells positive for SO. (T) Total SO production measured with fluorescence microplate assay. For all pictures, the scale bar represents 50 μM. Quantitative data are presented as the mean of three biological replicates ± SEM. * p < 0.05, ** p < 0.01 and *** p < 0.001.

