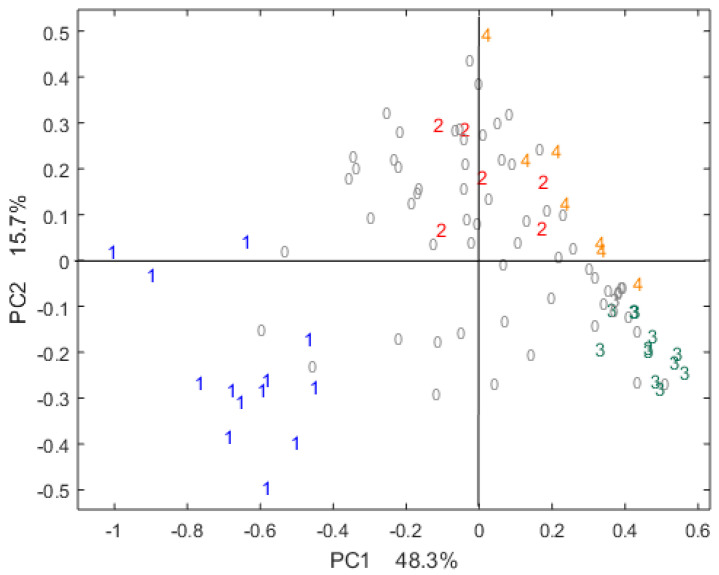
Figure 1.
Projection of the samples on the first two scores of the principle component analysis (PCA) performed on centered sensory data. Sensory pole cores are coded from 1 to 4 with different colors: 1 = core pole 1, 2 = core pole 2, 3 = core pole 3, 4 = core pole 4 and 0 = samples not belonging to any core pole.

