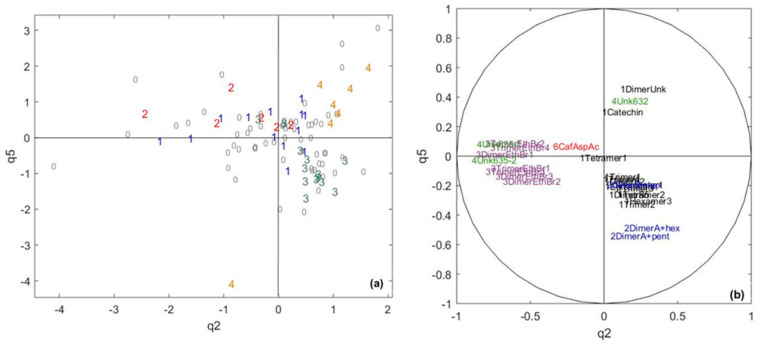
Figure 6.
The CCSWA on the chocolate and cocoa data, a cocoa-specific space: (a) score plot. 1 = core pole 1, 2 = core pole 2, 3 = core pole 3, 4 = core pole 4 and 0 = samples not belonging to any core pole. (b) Correlation circle. Black = flavan-3-ols, blue = glycosylated flavan-3-ols, purple = ethyl-bridged flavan-3-ols, green = unknown compounds and red = hydroxycinnamic acid.

