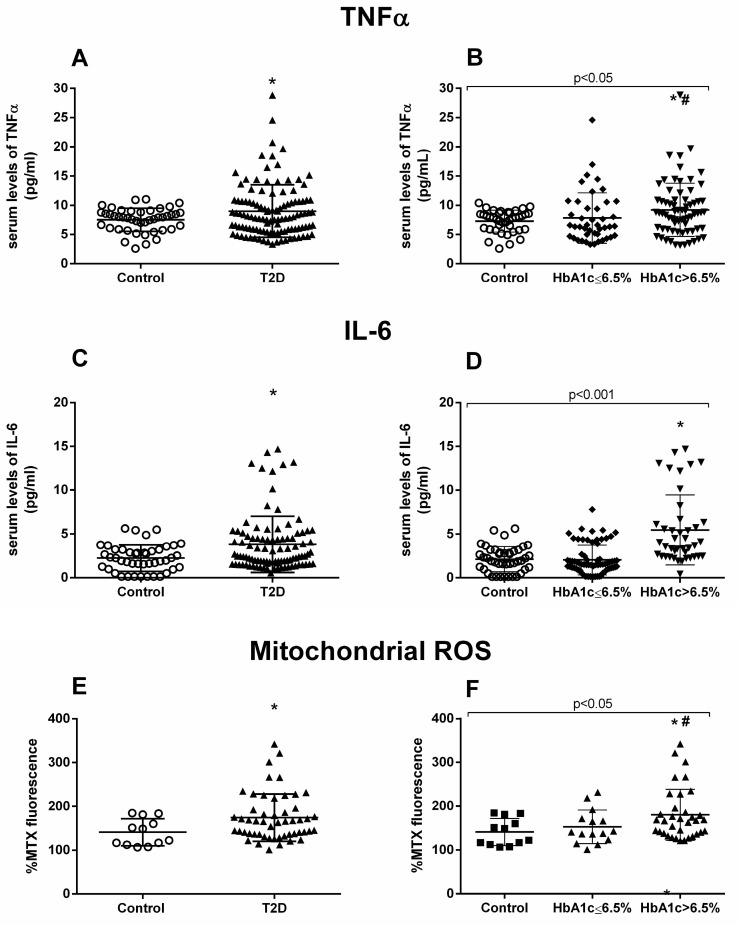
Figure 1.
TNFα, IL-6, and mtROS measurements. Serum levels of proinflammatory cytokines TNFα (A,B) and IL-6 (C,D), and fluorescence levels of mtROS (E,F). Differences between control and T2D groups (A,C,E) or between control, well-controlled (HbA1c ≤ 6.5%) and poorly controlled diabetic groups (HbA1c > 6.5%) (B,D,F) are shown. Statistical analysis was performed using a t-test to compare two groups, and using ANOVA with Bonferroni post-test for three groups. *p < 0.05 vs. control; # p < 0.05 vs. T2D HbA1c < 6.5%.

