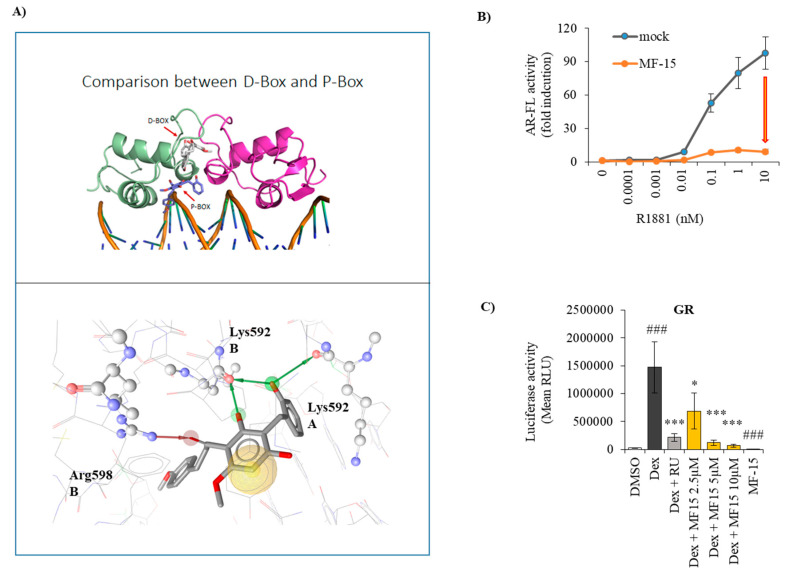
Figure 6.
MF-15 targets within the AR-DBD. (A) Upper image: Docking poses of MF-15 in the D-box (white) and the P-box of the AR-DBD (blue). The A chain of AR is shown in green and the B chain in magenta. Lower image: Interactions of MF-15 within the P-box binding site. Green arrows signify hydrogen bond donor interactions with Lys592 (from the A and B chain), the red arrow marks a hydrogen bond acceptor interaction with Arg598. The yellow sphere represents hydrophobic contacts between ligand and binding pocket. (B) PC-3 cells were transiently transfected with AR-FL and incubated with increasing concentrations of R1881 without (blue curve) or with 10 µM MF-15 (orange curve) in the reporter gene assay described before. Data represent the mean ±SEM from three independent experiments. (C). PC-3 cells were transiently transfected with GR under the control of a ARE2TATA promoter and seeded into 96-well plates in RPMI + 2% FCS supplemented with 10 µM MF-15 alone or with increasing concentrations of MF-15 or 5 µM mifepristone (RU) and 1 nM of dexamethasone (Dex). Luciferase reporter gene activity was determined with Nano Glow Dual Assay (Promega) by measuring absorbance on a CYTATION multiplate reader instrument. Data represent the mean ±SEM from three independent experiments. Statistical comparisons to the mock control were expressed in the graph with a hash key (### p < 0.001) comparisons to R1881 with an asterisk (*) (* p< 0.05, *** p < 0.001).

