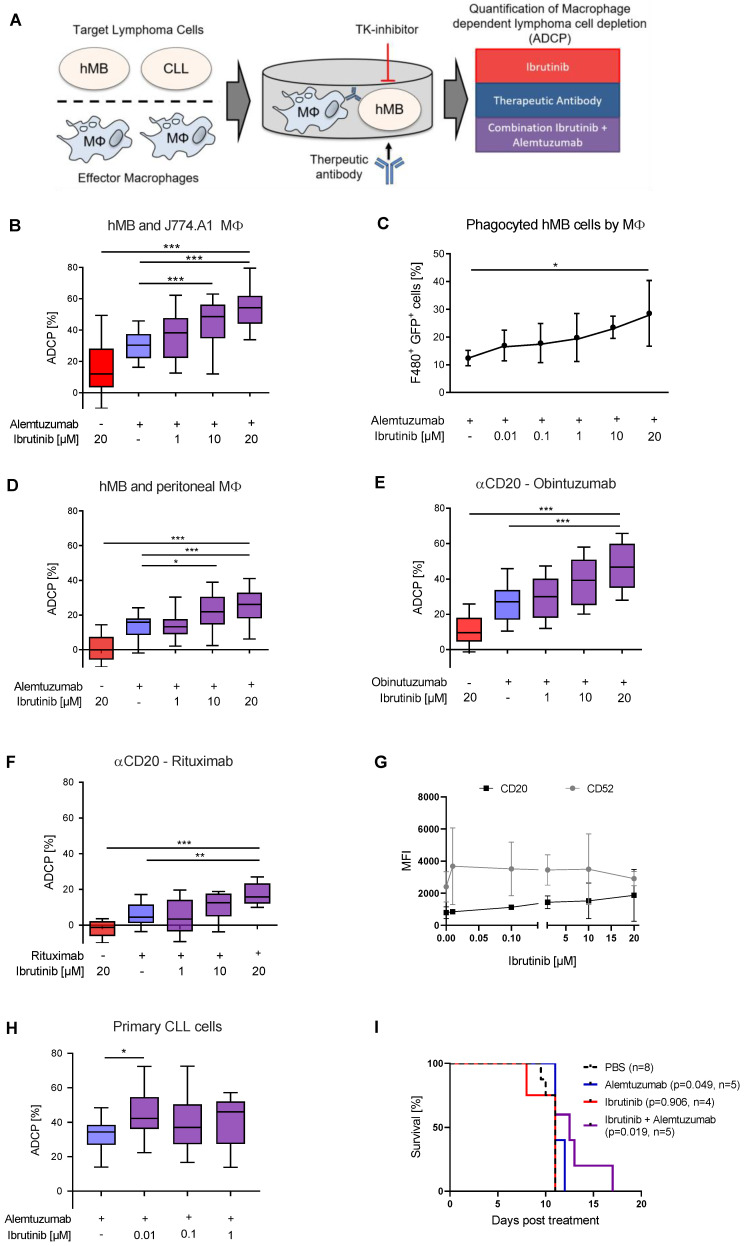
Figure 1.
Ibrutinib enhances macrophage-mediated antibody-dependent cellular phagocytosis (ADCP) (A) Schematic of Antibody Dependent Cellular Phagocytosis assay. Co-cultures of macrophage effector cells and lymphoma target cells were treated for 17 h with tyrosine kinase (TK) inhibitors and therapeutic antibodies in combination or as monotherapy. Lymphoma target cells were measured by flow cytometry. (B) Box plot showing ADCP of hMB “Double-Hit” lymphoma cells and J774A.1 macrophages treated with ibrutinib and alemtuzumab. (C) Bar graph showing phagocyted hMB cells by J774A.1 macrophages, measuring GFP+ hMB lymphoma cells and F4/80+ macrophages in an ADCP model treated with ibrutinib and alemtuzumab. (D) Box plot showing ADCP of hMB lymphoma and murine peritoneal macrophages as effector cells treated with ibrutinib and alemtuzumab. (E,F) Box plot showing ADCP of hMB lymphoma cells and J774A.1 macrophages treated with ibrutinib and anti-CD20 antibody (E) obinutuzumab and (F) rituximab. (G) Expression of CD20 and CD52 surface markers after ibrutinib treatment of hMB lymphoma cells. (H) Box plot showing ADCP of CD19+ primary chronic lymphocytic leukemia (CLL) patient cells (N = 6) pretreated ex vivo with ibrutinib for 24 h and co-cultured with J774A.1 macrophages. Alemtuzumab treatment was applied for 24 h. The graphic shows the relative macrophage-dependent cell death in the presence or absence of antibody. (I) Kaplan-Meier analysis comparing the survival of male hMB transplanted NSG mice receiving ibrutinib and alemtuzumab as mono therapy or in combination. PBS was used as control. The treatment was given i.p. 10 days after i.v. hMB cell injection. All box plots show the median, the 25th and 75th quartiles, and the minimal and maximal value. All bar graphs display the average and SEM. Unless otherwise stated experiments were performed of at least three biological replicates. (* p < 0.05, ** p ≤ 0.01 and *** p ≤ 0.001).

