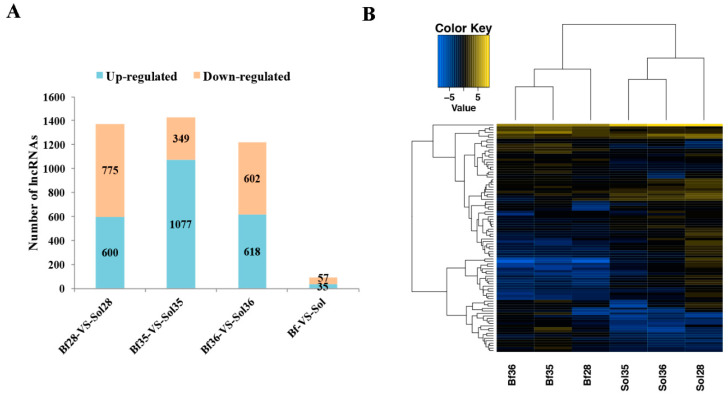
Figure 1.
Statistics and heat map analyses of differentially expressed (DE) long non-coding RNAs (lncRNAs). (A) Statistics of DE lncRNAs. The X-axis represents the different compared groups, Biceps femoris (Bf) vs. Soleus (Sol) indicates the DE lncRNAs from the DEseq2 method; Bf28 vs. Sol28, Bf35 vs. Sol35, and Bf36 vs. Sol36 indicate DE lncRNAs from the DEGseq method. The Y-axis shows the number of DE lncRNAs. (B) Heat map analysis of DE lncRNAs between Bf and Sol muscles. Heat map analysis was conducted with 92 overlapped DE lncRNAs among three different comparative groups (Bf28 vs. Sol28, Bf35 vs. Sol35, and Bf36 vs. Sol36). Each column represents a sample and each row represents a DE lncRNA. Yellow and blue gradients indicate an increase and decrease in gene expression abundance, respectively.

