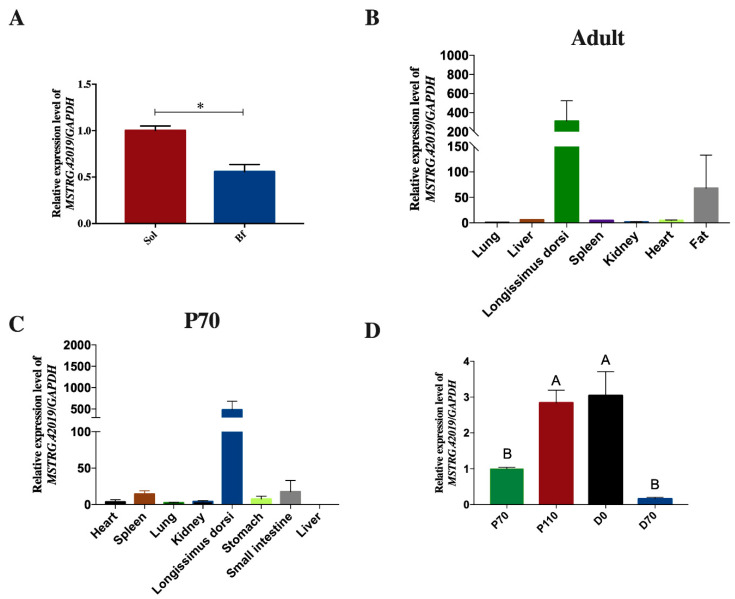
Figure 4.
Expression patterns of lncRNA MSTRG.42019. (A) Expression of lncRNA MSTRG.42019 in Bf and Sol muscles. (B) Expression profile of lncRNA MSTRG.42019 in different tissues of adult pigs, n = 3. (C) Expression profile of lncRNA MSTRG.42019 in different tissues of 70-day-old fetuses, n = 3. (D) Expression patterns of lncRNA MSTRG.42019 in Longissimus dorsi muscles derived from different developmental stages, n = 3. Expression levels were determined by qRT-PCR and relative expression levels were calculated using the 2−ΔΔct method and normalized to the expression of GAPDH. The expression of lncRNA MSTRG.42019 in the sample of the first column was determined as control and normalized to 1. All data are presented as mean ± SE, and an unpaired Student’s t-test in the Prism 7 software was performed to evaluate significant differences between Bf and Sol. ANOVA with Duncan’s test was used to evaluate significant differences between groups P70 (70 days of pregnancy), P110 (110 days of pregnancy), D0 (the day of birth), and D70 (70 days after birth). * p ≤ 0.05, different letters above the bars indicate significant differences; p < 0.01.

