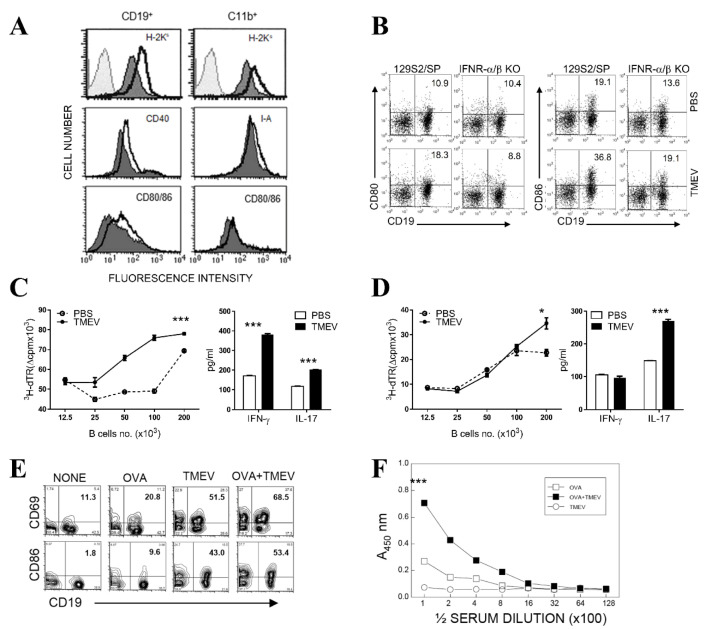
Figure 4.
Upregulation of cytokine production and costimulatory molecule expression following TMEV infection. (A) The levels of major histocompatibility complex (MHC) and costimulatory molecules on CD19+ B cells, and CD11b+ macrophages were determined by flow cytometry following infection with TMEV for 24 h. Gray line-colored histogram, isotype control; black line open histogram, TMEV-infected cells; and black line-colored histogram, mock-infected cells. (B) Costimulatory molecules on B cells of spleen from normal and IFN-α/βR knockout mice were determined by flow cytometry following infection with TMEV for 24 h. (C) SJL splenic CD4+ T cells from PLP139–151-primed SJL mice at 10 d post-immunization were stimulated with B cells from naïve SJL mice after infection with TMEV or mock-infection (PBS) for 24 h in the presence of the immunizing PLP139–151 peptide (2 μM) (left panel). The proliferation rate was determined by [3H]-thymidine uptake assay, and the values in the absence of PLP139–151 were subtracted (right panel). Cytokine levels (interferon (IFN)-γ and IL-17) in the culture supernatants of PLP139–151-primed T cells in the presence of 1 × 10⁵ mock-infected or TMEV-infected B cells were assessed using specific enzyme-linked immunosorbent assay (ELISA). (D) BALB/c splenic CD4+ T cells were stimulated with B cells from naïve SJL mice after infection with TMEV or mock-infection (PBS) for 24 h for alloantigen response assay. The proliferation rate was determined by [3H]-thymidine uptake assay (left panel), and cytokine levels in the culture supernatants were determined by specific ELISA (right panel). Statistical significance was analyzed by Student’s t-test. * p < 0.05; *** p < 0.001 (E) Costimulatory molecules on B cells of spleen from ovalbumin (OVA)-immunized and/or TMEV-infected SJL mice were determined by flow cytometry. (F) Antibody levels against OVA in serum from OVA-immunized and/or TMEV-infected SJL mice were determined by ELISA. The statistical significance between ova and ova+ tmev was analyzed by one-way ANOVA. *** p < 0.001. The presented data are representative of three independent experiments.

