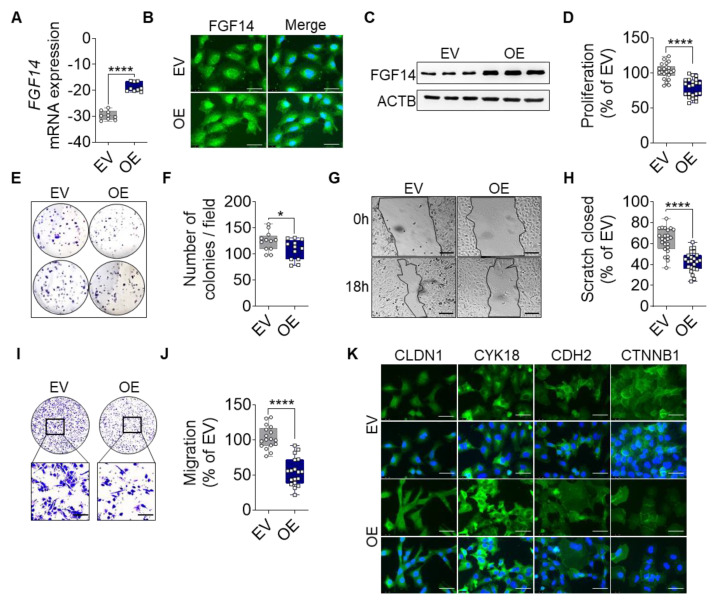
Figure 2.
FGF14 overexpression reveals a tumor-suppressive phenotype in vitro. Validation of FGF14 overexpression after transfection of A549 cells with empty vector (EV) and FGF14 expression vector (OE) was quantified by (A) qRT-PCR, (B) immunocytochemistry (ICC) staining and (C) Western blot. Cells in B panel were labeled using FGF14 antibody and revealed by an AlexaFlour 488 secondary antibody (green). DNA was stained with 4′,6-diamidino-2-phenylindole (blue), scale bars, 50 µm. (D) Cellular proliferation was quantified by BrdU incorporation of FGF14 OE cells compared to EV control cells. (E,F) Colony formation of FGF14 OE cells compared with EV control cells. The migratory ability of FGF14 OE cells was assessed via (G,H) scratch assay and (I,J) Boyden chamber assay. Representative pictures were taken at 0 and 18 h after scratching; scale bars, 100 µm. (K) ICC staining of epithelial (CLDN1, CYK18) and mesenchymal marker (CDH2, CTNNB1) labeled using an AlexaFlour 488 secondary antibody (green). DNA was stained with 4′,6-diamidino-2-phenylindole (blue), scale bars, 50 µm. Data are shown as mean ± standard error of the mean using Student’s t-test. P-values ≤ 0.05 were considered statistically significant for all analyses. (n = 3) * p ≤ 0.05 and **** p ≤ 0.0001.

