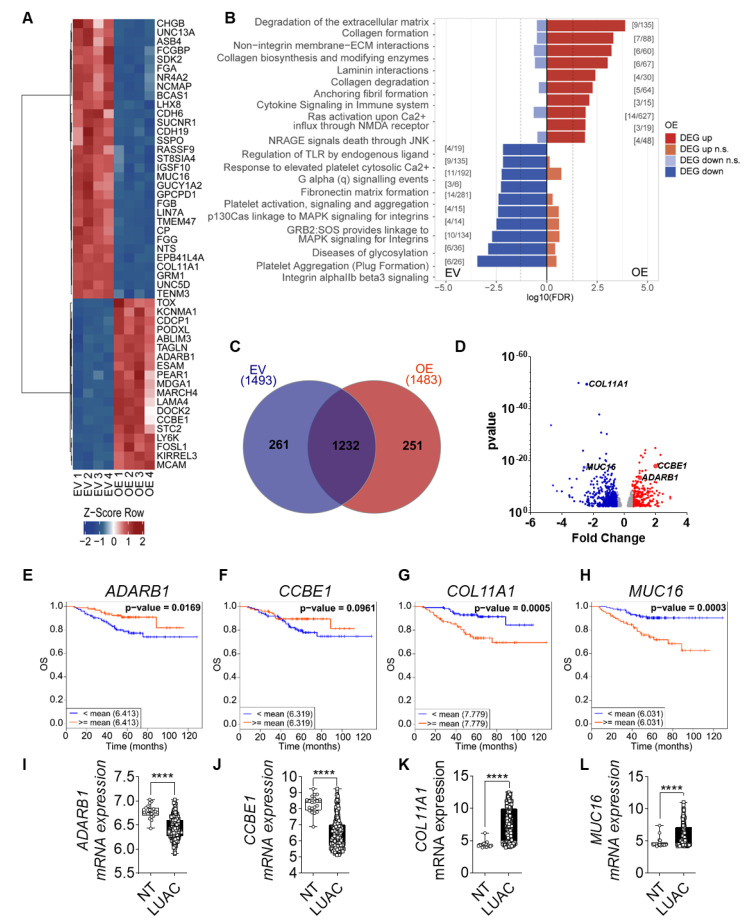
Figure 5.
FGF14 overexpression impacts gene expression profile of tumor cells. (A) Heatmap of top 50 most significant differentially expressed genes (DEGs) for each contrast (sorted by smallest adjusted p-value). (B) The DEGs, split into up and downregulated genes, a gene set enrichment analysis was performed using KEGG Orthology-Based Annotation System (KOBAS). The graph represents the top 10 gene sets or pathways enriched for up- or downregulated genes of one database (dashed line: p-value = 0.05). The graph only shows pathways that were not significant for both directions (up and down). Significant gene set enrichment was defined by the false discovery rate (FDR). (C) Venn diagram of DEGs using InteractiVenn [36]. (D) Volcano plot: bottom track = p-value based definition of a DEG (less stringent, only for comparison). (E–H) Kaplan–Meier estimate of OS among the Okayama patients dataset with LUAC classified according to the mRNA expression levels of CCBE1, ADARB1, COL11A1, and MUC16 as either high (above the mean value of mRNA levels, red) and low (below the mean value of mRNA levels, blue). (I–L) mRNA expression level of in LUAC samples from the same study compared with non-tumor tissue. Data was obtained from CANCERTOOL. Data are presented as mean ± standard error of the mean using Student’s t-test. p-values ≤ 0.05 were considered statistically significant for all analyses **** p ≤ 0.0001.

