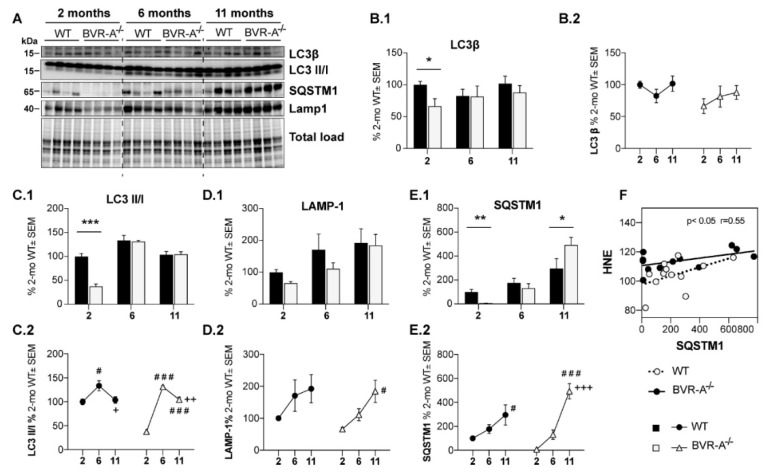
Figure 4.
Reduced autophagosome maturation occurs in the cerebral cortex of BVR-A−/− mice. Representative western blot images (A) and densitometric evaluation of LC3β (B.1,B.2), LC3 II/I ratio (C.1,C.2), LAMP-1 (D.1,D.2) and SQSTM1 (E.1,E.2) levels in the cerebral cortex of WT and BVR-A−/−mice at 2 (n = 4), 6 (n = 4) and 11 (n = 4) months of age. Protein levels were normalized per total protein load. Data are expressed as percentage of WT mice at 2 months set as 100%. Columns were used to show differences among the groups (WT vs. BVR-A−/−) while dots to show age-associated changes within each group. Data are expressed as Mean ± SEM. For columns: * p < 0.05, ** p < 0.01, *** p < 0.001 vs. WT (2-way ANOVA with Fisher’s LSD test). For dots: # p < 0.05, ### p < 0.001 vs. 2 months; + p < 0.05, ++ p < 0.01, +++ p < 0.001 vs. 6 months (2-way ANOVA with Fisher’s LSD test). (F) Pearson correlation between SQSTM1 and HNE levels in WT and BVR-A−/− mice.

