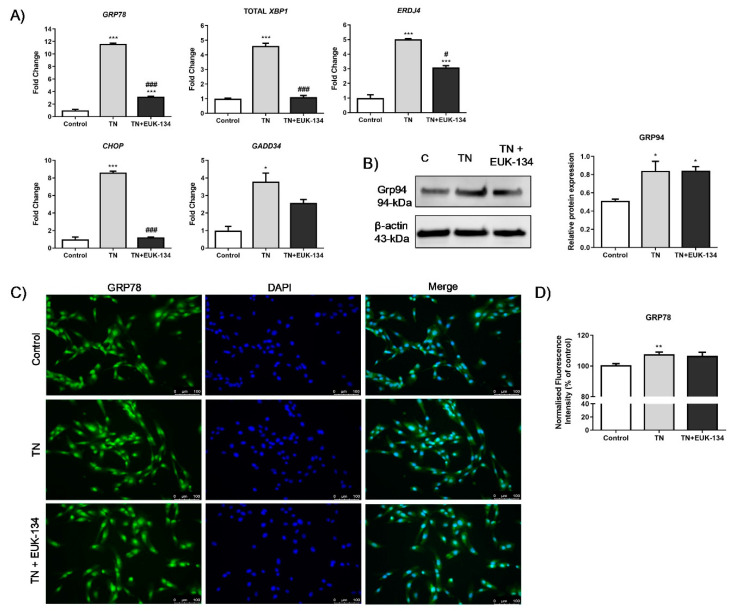
Figure 1.
ER stress activation in tunicamycin-treated cells with or without EUK-134. (A) Relative fold changes in gene expression for ER stress markers. Data represent the mean fold change normalised to 18S housekeeper gene ± SEM of ΔCt values (n = 3). (B) Cropped representative Western blot image and quantification of GRP94 protein levels relative to β-actin (loading control). Data represent the mean ± SEM (n = 3). (C) Representative images of human skeletal muscle myoblast stained for GRP78 (green) and DAPI (blue). Images captured at 20× magnification. Scale bar = 100 μm. Brightness was adjusted equally in each image to enhance visualisation. (D) Quantification of total GRP78 fluorescence intensity normalised to nuclei number, relative to control (%). Data represent the mean ± SEM (n = 26). * p ≤ 0.033, ** p < 0.002, and *** p < 0.001 against vehicle control or tunicamycin alone (#).

