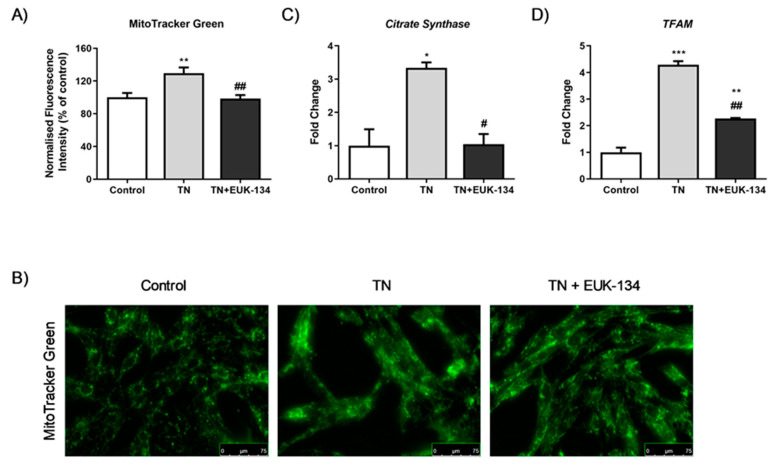
Figure 4.
Mitochondrial biogenesis of tunicamycin-treated cells with or without EUK-134. (A) Representative graph of mitochondrial mass/volume showing the relative change (%) in MitoTracker Green fluorescence intensity, normalised to protein content. Data represent the mean ± SEM (n = 12). * p ≤ 0.033, ** p < 0.002, against vehicle control or tunicamycin alone (#). (B) Representative images of mitochondrial staining in human skeletal muscle myoblast using MitoTracker Green acquired under cell culture conditions. Images captured at 40× magnification. Scale bar = 75 μm. Brightness was adjusted equally in each image to enhance visualisation. (C,D) Relative fold changes in mRNA expression of Citrate Synthase and TFAM. Data represent the mean fold change normalised to 18S housekeeper gene ± SEM of ΔCt values, (n = 3). * p ≤ 0.033, ** p < 0.002, and *** p < 0.001 against vehicle control or tunicamycin alone (#).

