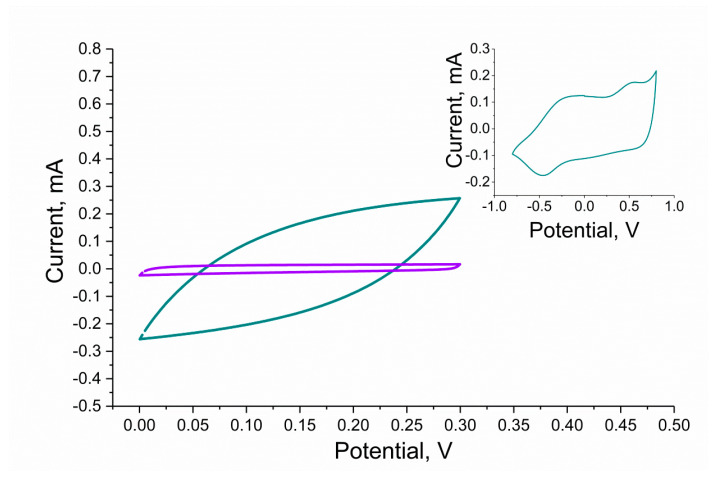
Figure 5.
Comparison of electrochemical properties of anhydrous (violet curve) and hydrous (blue curve) RuO2 tested with the use of cyclic voltammetry in the potential range from 0 to 0.3 V, inset: voltammogram of hydrous RuO2 registered in a broader potential window from −1.0 to 1.0 V. Remaining cyclic voltammetry (CV) parameters: scan rate: 0.1 V/s, electrolyte: 0.01 M KCl.

